The SCW Q&A: Eric tackles your questions about the upcoming freeze

On Thursday afternoon, Eric spent about an hour answering questions regarding the upcoming freezing weather event on the SCW Facebook page. There were more than 550 comments left, and Eric was able to get to a little more than 40 . You can read the best and most useful below. We’ll plan another one of these before the freeze hits, so stay tuned!


Q. I’m an essential worker in the med center, the hospital told us so far they don’t intend to call in the ride out team to where we have to stay at the hospital saturday-monday but that it could change. do you expect the conditions to get worse in the medical center area of houston or to stay the same?

A.
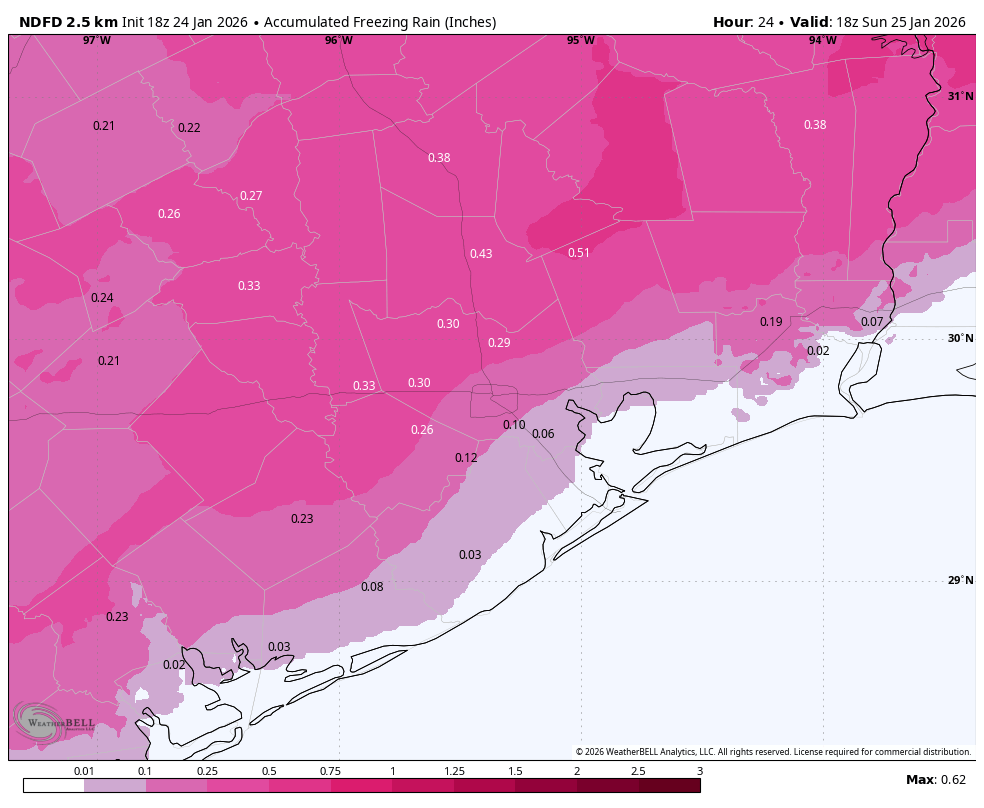
I think that’s a prudent decision by the hospital. At this point I would lump the Medical Center in with “urban Houston,” and whether we see icy roads will depend on air temperatures on Sunday in the city. I wrote about this in our Thursday afternoon update, with the “Slower freeze” and “Faster freeze” scenarios.

Q. What impact will the ice further north of Houston have on statewide power grid? I read your post about centerpoint expecting to have sufficient power, but wasn’t sure if the broad band of icy weather could reduce the available power source again or if we are safe as long as we don’t have ice taking down local lines.

A.
We are really beyond my area of expertise here. ERCOT is projecting a power surplus through the event, but certainly there could be issues with icy roads (i.e. getting workers and delivery trucks to these plants). But my sense is that generation will be up to the task with this cold weather. I hope those are not famous last words.

Q. How does the forecast compare to what we expected and what happened during [the 2021 freeze event]?

A.
That lasted longer (about four days of very cold air) and its coldest temperatures were 5 to 10 degrees below what we are likely to experience this weekend. In terms of magnitude of cold, it was a more significant event.

Q. Is this weather system expected to be severe and disruptive enough to force Houston Medical Center hospitals to reduce operations? (For those of us with scheduled procedures on Monday.) Thank you!

A.
It’s a good question. I cannot see hospitals closing, but out of caution they may cancel non-emergency procedures. It will depend on the likelihood of icy roads (impacting the ability of employees and patients to get to the hospital). We should know in another day or so whether that’s likely to occur in Houston.

Q. My niece is getting off her cruise ship on Saturday around 8:00 am and needs to drive home to Mineral Wells near Fort Worth. Is this a good idea?

A.
I don’t think so. I think she’d be fine until she gets about half way to Dallas-Fort Worth from Houston, maybe even a little further. But after that point the risk of freezing rain is going to start going up. And being stuck in that is a potential nightmare.

Q. I need to fly to Hartford, CT or Albany (I have a choice) on Sunday leaving at 2 pm. Would leaving out of Hobby be a better choice than IAH? What are the chances the flights can go from Houston Sunday at 2 p.m.?

A.
Hobby is a better choice. As for flights from Hobby it will depend on air temperatures, but I think there is probably a better than 50:50 chance that the airport is operational on Sunday afternoon.

Q. Can you pull the curtain back and tell us what your process is for monitoring these storms, when they seem to change over time? Are you constantly checking or every 2-4 hours for one model, 6-8 for another, etc?

A.
There are about a dozen models I’m checking. Some update every hour, others every 6 hours, and a handful every 12 hours. So they’re all over the map. I wake up around 5:00 am and spend a long time preparing for the morning forecast. Then, for sanity’s sake, I’ll take a break for a few hours before looking at all the data coming out by or before noon.

Q. Do you hang your toilet paper roll over or under? Just kidding, maybe. All jokes aside, do you recommend dripping faucets overnights or periodically throughout the day/evening?

A.
Over, of course! The notion of dripping faucets is a little bit controversial. We weighed in here, about a year ago.

Q. Are we getting really hard freeze events more frequently? I feel like it’s an annual thing now whereas until 5 years ago I felt like it was every 5 years or so we would see temps as low as upper teens.

A.
This is something I want Matt to dig into when we come up for air. In the last five years we have gotten four pretty stout hard freezes and that does not feel normal for Houston, at least over the nearly 30 years I have lived here.

Q. I run a flag football little league with a few hundred kids age 6-14 involved. I am cancelling the games we had scheduled Sunday, but we had many scheduled Saturday until about 3:30 pm. Do you think there’s any way we can play in the weather Saturday, for example, could it be in the high 50s?

A.
Sounds like this is an awesome initiative. I think temperatures will be fine on Saturday before 3:30 pm, but it is likely going to be raining, and at this point I believe there is also a chance of thunderstorms. So this probably is not the best environment to have children outside.

Q. What is causing the confusion amongst forecasters? Within my viewing area, many of the news meteorologists are forecasting slightly different outcomes.

A. It’s largely because it is not clear what temperatures will be in Houston on Sunday from about 10 am to 6 pm. This is the period when we could really see ice form on roads, or not. And, at present, the range of temperatures for this time period is roughly 30 to 40 degrees, depending on your choice of model or ensemble. This is why you’ve seen me constantly saying, “We’re not sure yet!”

Q. At the coldest, what do you estimate the low temperature spread will be for Houston proper (N, S, E, W) vs. Katy, The Woodlands, Kingwood, and Galveston? (The “outlying areas” are usually different from town.)

A.
For The Woodlands and Katy I would put lows between 18-22 degrees on Monday morning; 19-24 in Houston, and 22-30 right along the coast.

Q. Best timing for covering outdoor plants? Saturday afternoon/evening so they get some rain or better to go ahead and cover them on Friday?

A. I’d think whenever you can get to it. Most plants got a lot of beneficial rain on Wednesday.

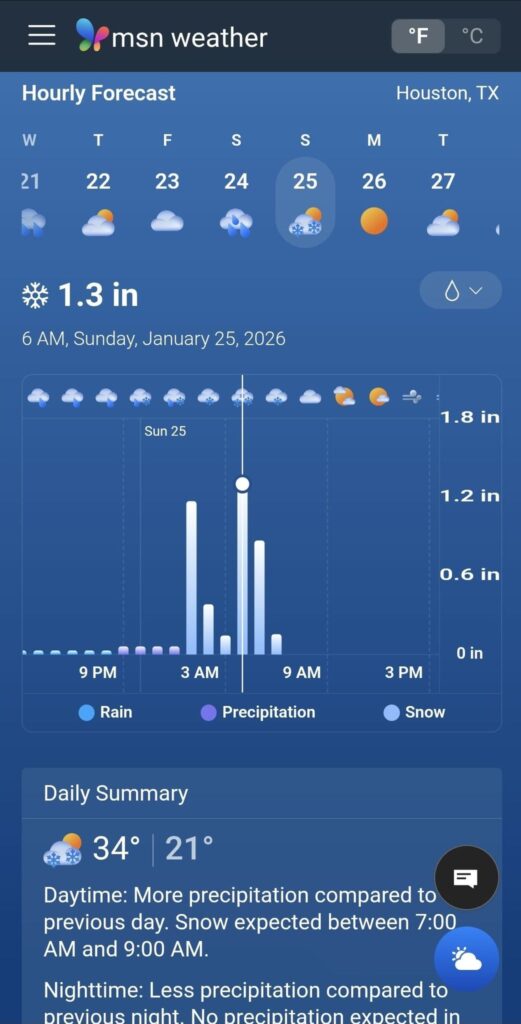
Q. What is MSN smoking?

A. I don’t know. It’s difficult for me to see snow falling much south of Dallas and Fort Worth, and certainly not in Houston. There are a lot of great weather apps out there, but at the end of the day it helps to have a human in the loop to ground truth all this data.

Q. Should Katy evacuate??? IYKYK 😜😂

A. Check the Settings, then the Notifications item in our app to get a definitive answer to this!

The SCW Festivus Q&A: White Houston Christmas, grievances aired, jet stream moves, drought ends, new normals

Since it appears that Houston not only will miss out on a white Christmas, we’ll have pretty toasty one instead, we thought we’d spread some holiday cheer with a Festivus-themed Q&A. We do these every so often, and you can always leave questions for future Q&As in the Weather Talk category of our Discourse forum. Time to saddle up Rudolph and get to answering!


Q. You’ve been talking about “White Christmas” a lot, but how many times in Houston have we actually had snow on Christmas Day? Is that kind of information readily available and if so, where would I find it?

A. Snow on Christmas feels like a true Festivus miracle in Houston. This is because our city is located pretty far south, and near the warm Gulf. It can snow here and roughly speaking we get at least some flurries about once every four years. But most commonly these snowfalls come in January or February. It is more difficult to get air cold enough, with lingering moisture for snowfall, in December. But we have had one White Christmas in Houston, at least for a majority of the area.

Not Christmas (Jan. 21, 2025, actually), but if it snowed on Christmas in Houston, this is what it might look like! (Dwight Silverman photo)

Most locations along and south of I-10 recorded meaningful snow on Christmas Eve, 2004. Areas such as Alvin and Brazos got 6 or more inches (see more totals here). I lived in Clear Lake at the time, and I remember walking outside that night, holding my two-month-old daughter, so she could experience it. For most locations the snow stuck into Christmas morning. Houston had never recorded a White Christmas before then, and we have not since. So yes, it is possible. But the odds of seeing one again in our lifetimes is probably pretty low. The chance of it happening this week is zero.

I don’t know of any source of information that’s just about snowfall, but you look up historical weather data here and here.

– Eric

Q. Sometimes I feel like this forecast is for a completely different city. I ran outside this morning in a T-shirt and shorts and at no point was I cold. Also, my temp was 47 on my ride into work at 4 a.m. today, Tomball to Woodlands. Last week, or maybe two weeks ago, my dashboard thermometer said 39, and it was legitimately cold outside. And again, SCW said it hit freezing that day. Something with the temps doesn’t align with what I actually see. It’s a solid 8-10 degree gap each time. What gives?

A. All right, air your grievances, reader!

So, we can’t speak specifically to the cases you’re talking about here. However, there is some context to add. First off, never, ever trust your car thermometer. Just don’t. Most temperature sensors in the area are calibrated to a certain degree of accuracy, whereas your car thermometer can be wrong due to any number of reasons. Even at night, when heat isn’t radiating off the pavement, it can still be too warm. Perception and reality are two very different things.

On any given morning, there can actually be temperature variability. Take last Monday for example. Temperatures ranged from 28 to 35 across the region in the morning. Back on December 9th, the differences were even greater, with temperatures ranging from 36 to 48 degrees. Morning lows depend on proximity to the Gulf, urban heat island, and cloud cover, among other things. So we may say that it’s freezing in parts of the area, which would be true. However, in other parts? Maybe not.

And your own personal experience running with a T-shirt and shorts is probably different than if my neighbor chose the same attire. (For the record, I’d probably be with you on it not feeling too bad.) Everyone adapts to cold differently and feeling one thing or seeing one thing in your backyard and seeing another in another location doesn’t necessarily make any of those temperatures incorrect. But just don’t use the car thermometer!

Matt

Q. What makes the jet stream move? Why does it move north and south, and give us El Niño and La Niña?

A. The jet stream is, essentially, a narrow river of wind in the upper atmosphere at about 30,000 feet. This is near the cruising altitude of many airplanes. The jet stream shifts north and south in response to cold and warm air masses. Generally, the Northern Hemisphere jet stream shifts north during the summer and shifts south during the winter months.

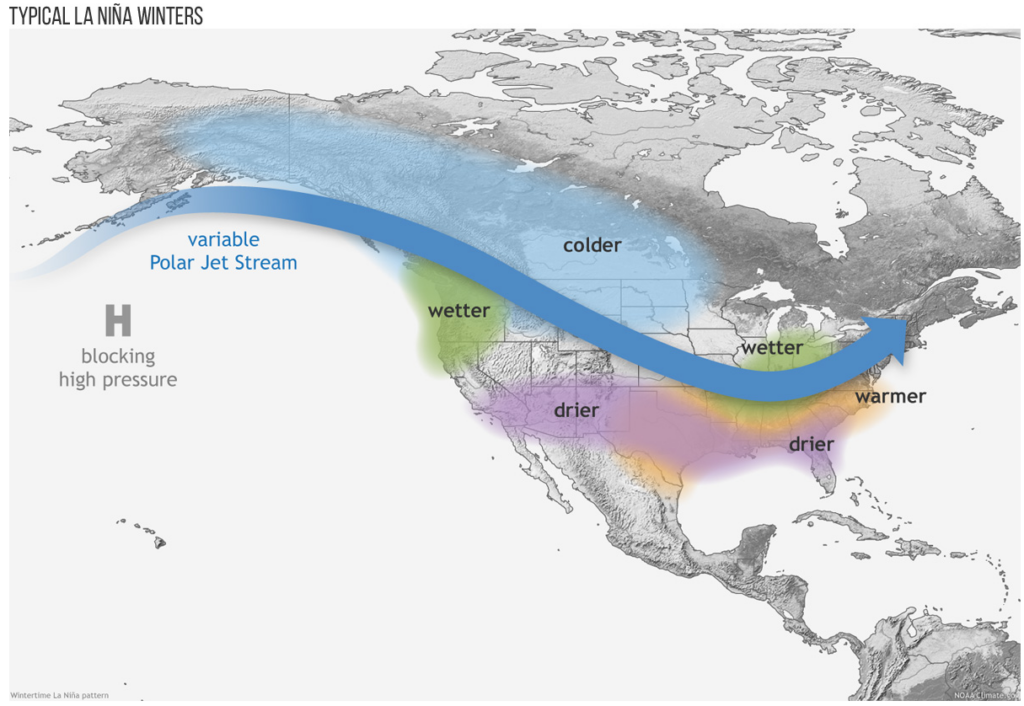
As you note, the presence of El Niño and La Niña also play a role in the location of the jet stream. For example, we are currently experiencing a La Niña in the equatorial Pacific Ocean, which should continue for the next month or two. During a La Niña winter the jet stream often meanders high into the North Pacific and and is less reliable across the southern tier of the United States. For us in Texas, that generally means a warmer and drier winter, which we are going to experience this week.

A typical La Niña jet stream setup. (NOAA)

Q. I finally got rain at my house! Things are still a little dry but it was welcome. How much rain has to fall before a drought is considered over?

A. The unsatisfying answer to this question is very much “it depends.”

During the horrific 2011 drought in Texas, some places would have needed 20 inches of rain over a sustained period of time to end the drought. Back in the hotter but slightly less drought-plagued 2023 summer, we needed about 6 to 12 inches to end the drought here in Southeast Texas.

Much like every flood, every drought has a unique set of circumstances. It depends on the time of year, duration of dryness, prior weather in the weeks and months leading up to that point, soil and geography, and on and on. All droughts have fingerprints that differ from previous ones. Some are more water-supply problematic. Others are not a problem for water supply but a serious one for farming and livestock. Some come with high fire danger, others will slightly less fire danger. Again, it all depends.

In general, you want to make up most of the deficit you’ve accrued since the drought began, but it needs to occur over a sufficiently long period of time for the soil and system to respond adequately. Getting 20 inches of rain in a day when you’ve racked up a 20-inch deficit over 8 months will only temporarily ease drought. But 15 inches of rain spaced out over 3 months is probably enough to do it. Like all things weather and climate, it’s nuanced!

– Matt

Q. With climate change causing, well, changes to the climate, at what point does “unusual for the season” become “the new normal”? When do meteorologists get to say “80 on Christmas is about normal for this time of year”? And I wish I didn’t have to ask this question!

A. I wish that as well. But here we are.

When meteorologists use normals, we are referring to an average of temperatures over the past 30 years. (To see Houston’s normal temperatures, go here). These get updated every decade. So at present, our “normal” temperatures are based on a period from 1991 to 2020. Over time these “normals” have been warming due, at least in part, to climate change. For example, the map below shows how the dataset for “December maximum temperatures” changed when the dataset switched from 1981-2010 to 1991-2020. Nearly the entire country had a “new normal” that was 0.5 to 2 degrees warmer, on average.

At present the “normal” high is 64 degrees in Houston on Christmas Day, and the “normal” low is 44 degrees. This year, for many of us, the daily low on Christmas may not even reach 64 degrees. Hopefully meteorologists never get to the point where we say 80 degrees is “normal” for Christmas in Houston. If that does happen, however, our boiling planet will have a lot greater problems than just worrying about a warm Christmas in Texas.

– Eric

SCW Q&A: La Niña, drought talk, blue nights, ozone days, king tides, open forum

This month we’ve got a jam-packed SCW Q&A for you, with topics ranging from the eventual demise of La Niña to mysterious high tides to a new forum where you can talk weather, 24/7! The latter is also where you can now leave questions for this occasional Q&A series. Let’s get to it!


Q. I’ve heard a lot about the La Niña weather pattern that the US is apparently in. It indicates that we will have a warm and dry winter with above average temps. What is your realistic take on our upcoming winter? Will we ever have freezing temps or not?

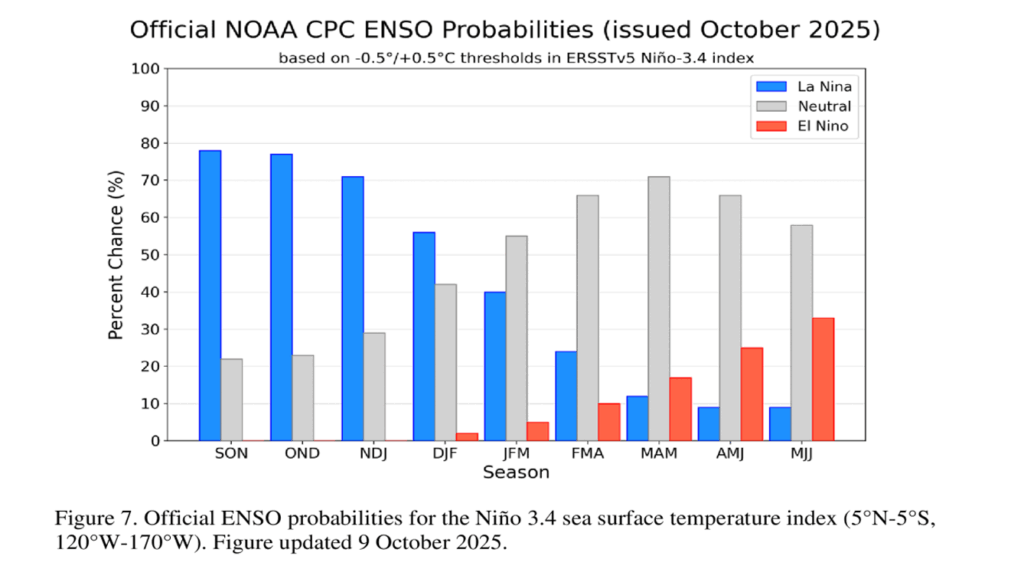
A. So yes, La Niña conditions are currently present in the equatorial Pacific Ocean. This means that sea surface temperatures in the region are mostly below average across the area. According to the latest forecast from NOAA, issued last week, La Niña conditions are likely to persist through winter, with a transition to ENSO-neutral conditions likely in during the January to March time frame next year. Predicting precisely when just is not possible.

Probabilities of ENSO for now into summer 2026. (NOAA)

Assuming that a moderate La Niña is in place this winter, what does that mean for Texas in general, and Houston in particular?

Typical climatological pattern during La Niña (NOAA)

La Niña’s largest impact lies in how it affects the jet stream. I’ve discussed in the past the mechanics of the jet stream, and how important it is to Texas weather. In a normal winter, the jet stream drives low pressure systems and cold fronts down from Canada and into the southern United States. La Niña limits the southern extent of the jet stream, minimizing the number and intensity of those cold, rain-laden fronts we typically see. This means Texas could see a drier, warmer winter than average, if typical La Niña patterns play out. Of course we have had some of our very coldest snaps during some recent La Niña winters, so this should not be treated as an absolute certainty.

– Eric

Q. It feels like we are in a drought. What conditions must exist for meteorologists say “we’re in a drought” and what conditions must be met before an area comes out of the drought?

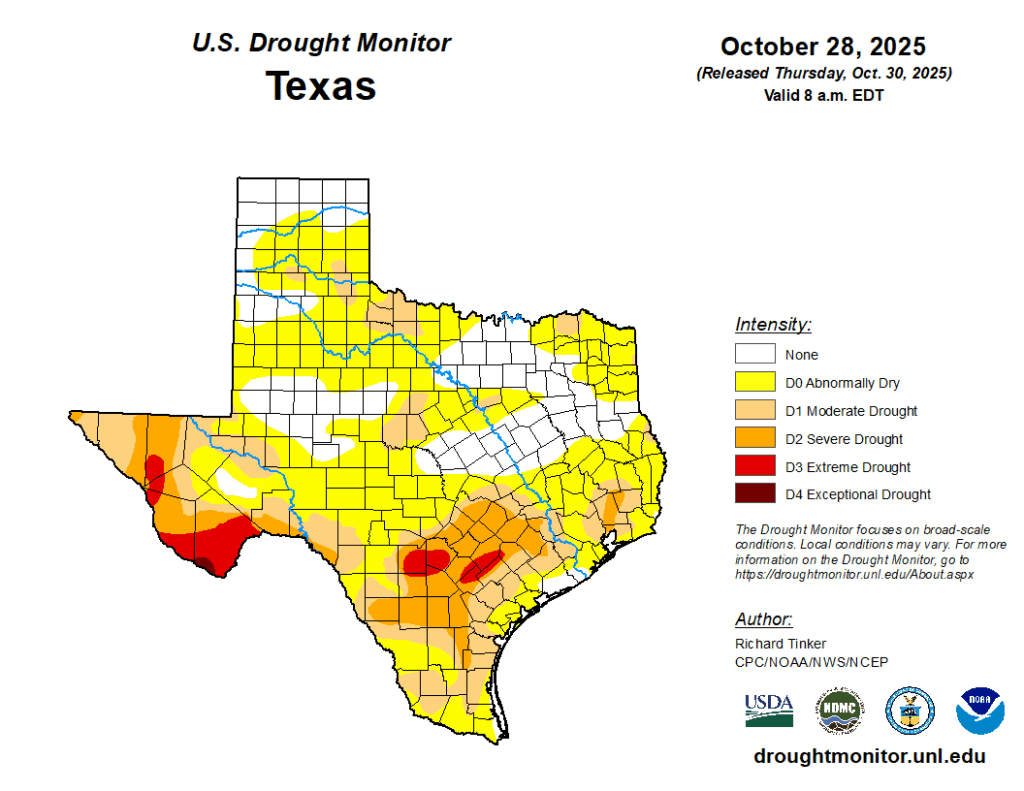
A. Generally, Matt and I rely on the U.S. Drought Monitor to determine drought conditions locally and nationally. They characterize the intensity of drought from “none” to “exceptional drought.” As of this week (with data through Monday, October 27) a little more than half of the Houston area is “abnormally dry” and a little less than half is in a “moderate drought.” If you’re interested in the methodology behind the drought determination, more information can be found here.

U.S. Drought Monitor product for Texas, released Thursday. (U.S. Drought Monitor)

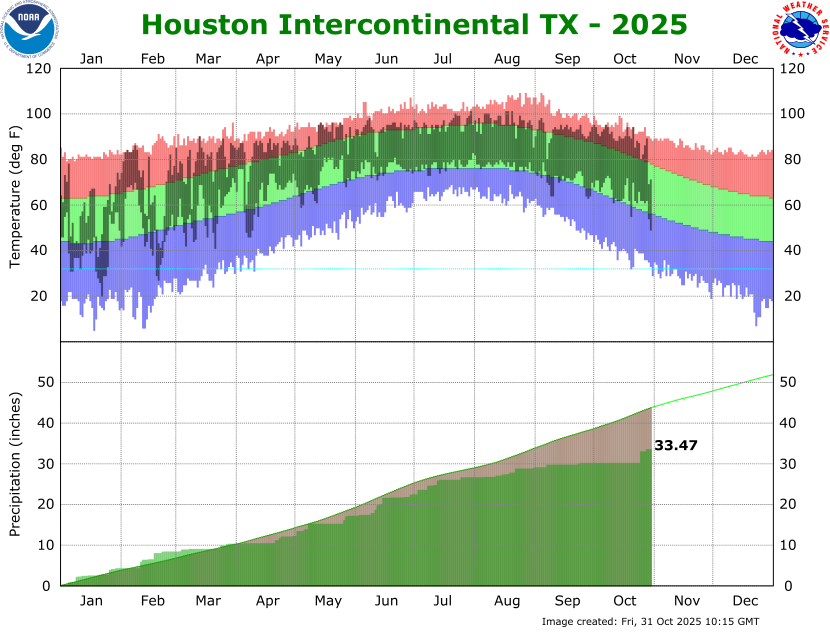
Another good resource is the climate page of the Houston/Galveston office of the National Weather Service. They have lots of good resources, but among my favorite are snapshots of annual rainfall totals compared to normal levels. From this it is pretty clear that the Houston region has been building up a rainfall deficit since early August. That is pretty consistent with the time I started watering my grass this year.

Houston temperature and rainfall series for 2025. (National Weather Service)

Note, also, you can see a spike in rain totals associated with recent rainfall. It put a dent in our annual deficit, but only a small one.

– Eric

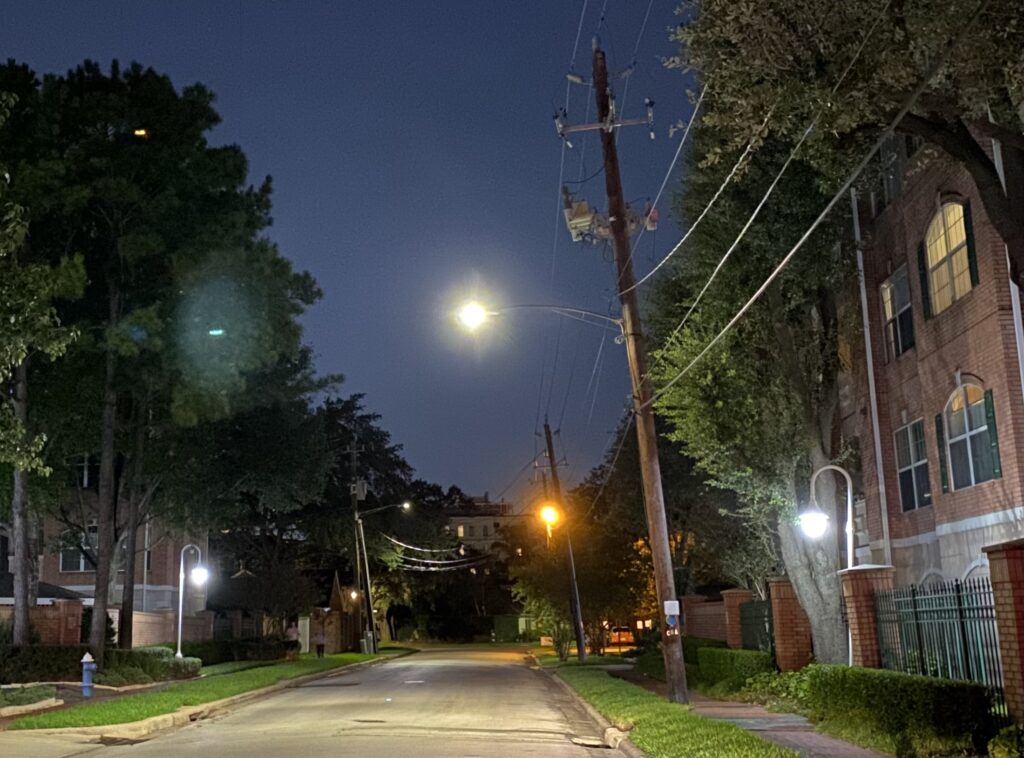
Q. I was visiting Houston and realized that the sky is blue at night. It’s not very dark like in nyc. Do you know why?

A. Interesting question! I don’t know the precise answer, but I would guess that one reason the sky over New York City at night appears to be a different ‘color’ or ‘tint’ than Houston is due to the presence of a larger number of skyscrapers and their bright lights in the Big Apple.

As for the blue color at night, that is largely due to the increased use of LED lights. Before about a decade ago, the vast majority of street and building lights were sodium-vapor lamps, which appeared more orange and yellow-ish. LEDs are much more efficient in terms of energy use. And they emit light at a shorter wavelength, in the blue-white portion of the spectrum. Shorter-wavelength light is scattered more efficiently. This leads to more bluish light bouncing around the lower atmosphere.

Both LED and yellow tungsten street lights are seen on this street in Houston’s River Oaks neighborhood. (Dwight Silverman photo)

Houston is also generally more humid than New York, and this extra humidity makes the effect more intense (water vapor in the atmosphere increases scattering).

– Eric

Q. We have had a lot of ozone days late summer / early Fall ( or at least it seems like it ). These days are usually drier in humidity and gorgeous. I’m pretty sensitive to the air quality. Even as far inland as Tomball it still affects me. Winds are from NWnot from SE( city of Houston air ) . What weather factors play into Ozone days? Lightwind, sun? Wind direction?

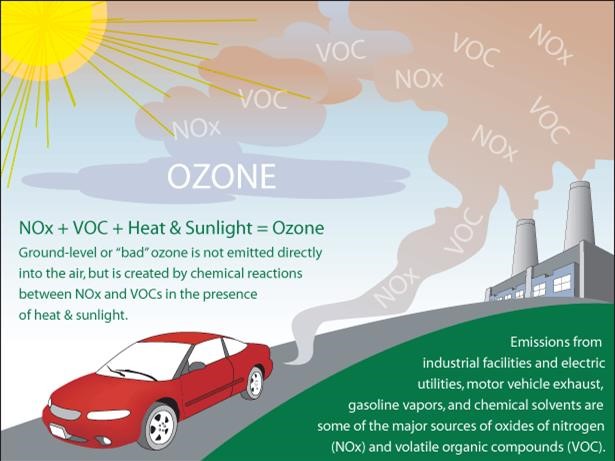
A. We do have a lot of ozone action days in Houston. Over the last 10 years, we have averaged about 37 per year. Just to refresh people’s memories, when we discuss “ozone action days,” we aren’t referring to the ozone layer in the stratosphere (or good ozone); we are discussing ground ozone, which forms through chemical reactions between nitrogen oxide and what we call “volatile organic compounds,” or VOCs. In plain language? The pollution emitted by cars, power plants, refineries, chemical plants, etc. will chemically react in sunlight to produce ground-level ozone.

(U.S. Environmental Protection Agency)

The reality is that some of the nicest days in Houston can be marred by pollution because maximum sunlight and clear skies usually follows cold fronts, ushering in lower humidity. You’ll see most of our ozone action days in autumn and spring behind cold fronts or sometimes behind winter fronts. We can also get them in summer when we have stagnant high pressure and minimal daytime thunderstorms. While it does tend to improve the farther you get from the population (Harris County) or industrial (Galveston County) centers, because Houston sprawls so much and so far, ozone issues can extend far into Harris County and even just beyond. Wind direction does not play much of a role, but cars, industry, and sunlight do.

– Matt

Q. We recently got an alert warning of coastal flooding potential while in Galveston. It was a strange sight considering we were used to seeing flood warnings before a storm, but rain wasn’t anywhere in the forecast. Yet, we encountered times where the beaches in the west end had no accessible sand because the tides were so high and our rented beach house had flooded roads. What caused this sudden high tide spree? A friend claimed it was a “noreaster” which popped up on my feed affecting the east coast, is that effectively a hurricane for side effects to other coastal areas? What gives?

A. Ah, the joys of living on the Gulf Coast. Blue sky flooding is a fairly common problem, and it has gotten to be more common due to the combination of sea level rise due to climate change and land subsidence as we pull groundwater out of aquifers.

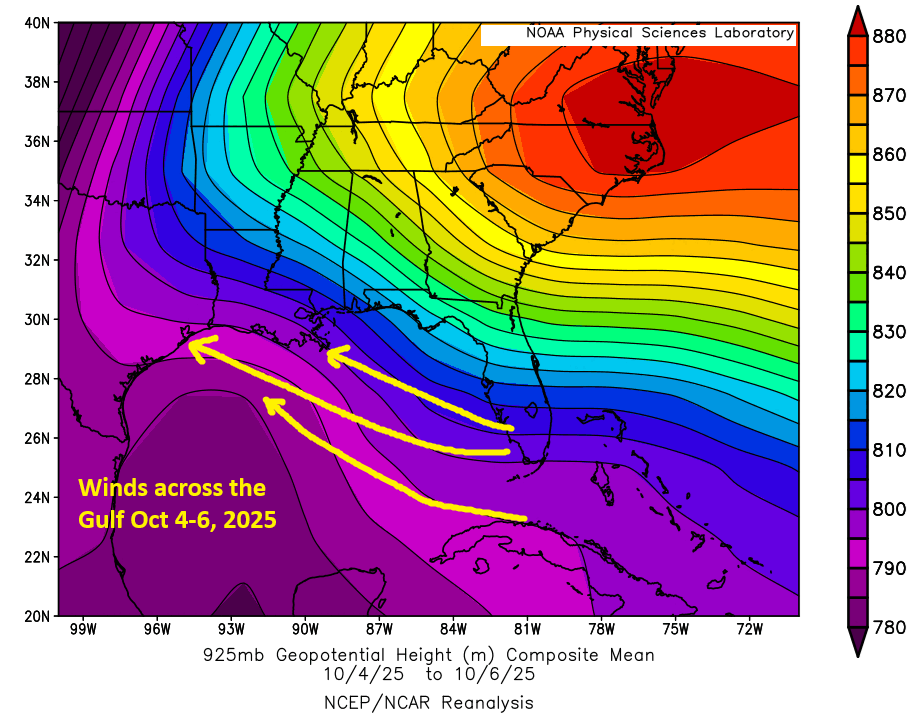
The day you’re speaking of was a day of what we call “king tides,” which are the astronomically highest tides of the year. Basically, the predicted highest tides in any year are king tides. We know when those will occur. But this year, we also had what we call a “long fetch” (more fetch than “Mean Girls”), which is to say easterly winds pushing across the length of the Gulf from Florida to Texas, which helped elevate tides a little more. The combination of king tides and the winds helped cause some coastal flooding without a drop of rain.

The average general wind direction from October 4-6 during the king tides in the Gulf. (NOAA)

The number of days of flooding in Galveston annually began increasing pretty significantly around 2015, peaking in 2020. We used to average about 5 or so back in the early 2000s and prior. We now average closer to 15 days a year. With continued sea level rise and ground subsidence, the number of days of routine high tide flooding without a storm nearby is likely to increase to perhaps as much as 30 to 40 days a year on average in the 2030s and beyond that in the future.

– Matt

Q. We like the new commenting system, but each category closes after a day. Is there a place where we can just chat in general about the weather? Or ask weather questions?

A. We’ve been getting more comfortable with Discourse as our commenting system, and now that things have settled down, we’re going to try out having a discussion area where people can talk about more general weather-related topics. Please feel free to try out the Weather Talk category!

Unlike the Space City Weather or The Eyewall categories, anyone can start a thread in Weather Talk, and discussions will stay open instead of closing in 24 hours.

We’d like to keep things focused on the weather rather than having free-ranging discussions, so please make your discussions weather-related! There’s a welcome post in the new forum with some more details on how we’d like things to go, so please check that first.

You can also use this forum to post questions you’d like to see in our regular Q&A feature (like this one!). When we get ready to post a new Q&A, we’ll scan that category for your queries. Got a question you want to ask now? Head over to Weather Talk!

– Lee & Dwight

SCW Q&A: Loopy radar, conflicting forecasts, rising houmidity, weather stations, sudden storms

This installment of the Space City Q&A is particularly tasty: Y’all came up with some very good questions! Keep them coming: Hit the Contact link at the top of the blog, or leave a query in the Discourse comments below this post.


Q. I have a question as to how weather radars generate their one-hour plus future radar loop. Some recent rain showers have been from storms that kind of pop up on the radar, meander around for a bit and then dissipate. They usually don’t have an easily defined direction to them like they might have if they were spawned from a frontal boundary moving in. However, on most radar loops that I watched, as the radar passes from the older, real radar data to the projected data, the storms go from wandering with no direction to a well defined direction. In reality, as time moves forward the storms end up meandering and don’t go in the predicted direction. Any thoughts as to why this occurs?

A. I am not an expert in predictive radar apps, but I have done some research in this area in the past. So I’m going to dive in a little bit here because I think it’s a good question.

First of all, as you’ve suggested, these predictive apps work best when there are clearly defined storm motions, such as along a frontal boundary. This is because the “nowcast” for 0 to 60 minutes is based on current radar readings and inferred motion vectors based on storm intensity, speed, and direction. More sophisticated methods might also incorporate flow equations, such as the Lucas–Kanade method. (Dear reader, it has been 30 years since I took an advanced mathematics class, and I’m not going to try and explain how that works. Because I really don’t know.) These forecasts are quite accurate for storms with clearly defined motions, but less so for other storms. I would trust them for about 30 to 60 minutes out, at most.

Predictive radar features found in popular weather apps, such as this one from Apple, are most accurate at 30-60 minutes.

Then there are medium-term forecasts that run from 1 hour out to several hours. These generally rely on a single high-resolution model, such as the High-Resolution Rapid Refresh (HRRR), or a blend of models with some AI-enhancement thrown in. Again, for something like a line of storms ahead of a frontal passage, these can be pretty accurate. But if storms are just popping up around the city during the afternoon, they’re probably not going to reliably tell you if it is going to rain at your house three hours from now. I mean, sure, they’ll get lucky some time. But they’re also going to miss. I wouldn’t trust any predictive radar app more than a couple of hours out.

–Eric

Q. It’s not new, but it feels more noticeable lately with the new weather reporter at the Houston Chronicle. I usually read him, check your forecast, and glance at the iPhone app. A recent day offered a good example: he predicted highs in the upper 90s, possibly hitting 100. My iPhone said 89. You (correctly) called for mid-to-upper 90s. How can one source call for 100 while another is calling for 89? I guess it feels like the spread is getting wider, not narrower. I’d expect the opposite with improved technology. I assume it comes down to different models, how showers affect afternoon highs, and maybe even some editorial choices (the Chronicle does seem to lean into more dramatic weather headlines recently).

A. I can’t speak for the Chronicle’s forecasts, but I know Justin Ballard tries to do a good job. And if there are sensationalistic headlines, they’re generally coming from online editors pressured to drive up traffic numbers rather than the forecaster. I dealt with this when I worked for the newspaper, which is one reason why I very much prefer working for myself.

Anyway, I suspect it may be a combination of things. When I say the highs in Houston are likely to be the mid- to upper-90s, I’m referring to the central portion of the area, i.e. Harris County. Daytime temperatures in the summer will invariably be cooler in Galveston, near the water, and often warmer further inland, such as in Conroe or Sealy. Perhaps Justin was referring to the forecast at Bush Intercontinental Airport, and I was more considering Hobby. That would explain the variance in our forecast.

As to why the iPhone said 89 degrees, perhaps it was forecasting an afternoon shower to keep things cooler? I don’t really know. But in general, a lot of the variety in temperature forecasts for Houston are due to its large area (more than 90 miles from Galveston to Conroe), varied nature of the terrain, urban heat island effect for the city’s core, and surface temperatures of the Gulf of Mexico. It’s … a lot to balance.

–Eric

Q: As far as climate change goes, rising global temperatures get a lot of attention, I was wondering if global humidity levels are trending upward, too? This year may be more an extreme example, but I was wondering: As the temperature rises, and more water evaporates from the oceans and other bodies of water, giving precipitation events “more to work with.” i.e. Has there been a noticeable shift upward in global average humidity levels?

A. When you think about humidity here in Houston – or “houmidity,” as we sometimes call it – you (should) think about dewpoint. Dewpoint is a measure of moisture in the air; it’s the temperature that the air would need to cool to for it to be saturated. When dewpoints are high, it feels very humid, hence why Houston’s summers are so generally awful; we have dewpoints often in the mid-70s to even upper-70s at times. Periodically, the immediate Gulf Coast can see dewpoints of 80°, and there have been instances of some places in the Middle East (Iran in particular) seeing dewpoints over 90°!

Why does it feel so humid? Warmer air holds more moisture. You could have a relative humidity of 100% with a temperature of 50° and a dewpoint of 50°. That feels damp or clammy, but it isn’t oppressive. But if you have a dewpoint of 75° and an air temperature of 75°, that feels disgusting. The relative humidity is 100% in that case too. But because the air temperature is warmer, it’s holding more moisture.

Houmidity is front and center in the Space City Weather app. (And remember, that spelling is a not a bug, it’s a feature!)

Thus, as climate change continues, we will see global humidity levels increasing too. A warmer planet has more capacity to hold moisture, so generally the humidity and dewpoints will be higher. You can read more from the UK Met Office here. Thinking about this locally, 2025 sure seemed like a fairly mild summer by almost anyone’s standards in Houston. But it was the 6th warmest on record because our nighttime lows were second highest on record. Put simply, the daytimes weren’t so bad, but the nighttimes were persistently very warm, even by Houston standards. Some of that is certainly urban heat island affect (more concrete = warmer nights). But it doesn’t explain why Bush, College Station, Galveston, and Hobby have all had top 20 or 30 hot summers every summer since 2016 (with the exception of 2017 in Galveston). That is likely because the atmosphere is warming, the Gulf is warming, and it’s able to hold more moisture and keep nighttimes much warmer than usual.

–Matt

Q: Are the CenterPoint Energy weather stations available to the public? If so, how do I locate and see the one near me?

A. Yes they are!

All the data from the sensors is being pushed out publicly through a company called “Synoptic,” which acts as a data source for various sources of weather observation data. The data can be accessed through a NOAA website (that’s a fantastic resource beyond just CNP weather stations). Within the Weather & Hazards data viewer, you’ll be presented with a buffet of sites you can choose from. These are not just CenterPoint weather sensors, but they include everything from Harris County Flood Control to Union Pacific Railroad to major airport sensors like at Bush and Hobby. You’ll have to click around a bit to find a CenterPoint one, but it’ll be a number 1-100, a location name, and then a suffix of CE. You can toggle the variable you want to see, including wind gusts, dewpoint, or rainfall, among others. There’s even a historical data mode on this site if you want to see observations from a particular date and time. It’s just a great site to bookmark!

NOAA’s Weather & Hazards Data Viewer. Click on a station to see its name. You can change the data you want to see at right. Bookmark the historical observations (3 day/7 day in the pop up bubble) for quick access to a site’s latest observations in the future. (NOAA)

There are also links to 3 day and 7 day histories as well. Those can be bookmarked for real time access updated every 10 minutes (such as this one for Sugar Land), and I would encourage you to bookmark the ones from any source closest to your house!

–Matt

Q: I live in Tomball off Texas 249/99 and we have had some intense storms Monday evening and Tuesday morning. It got so bad Monday evening that I got my family in the bathroom as winds had to be 40-50mph and were getting quarter size hail. The same thing happened this morning to where the wind was so intense that we had trees down in our neighborhood. I looked on my radar app and at the time, there was not even a Special weather statement. Later on they did issue it after it had passed through. I have seen storms that were severe warned that were much less intense. How a storm can be that intense and the NWS didn’t have any warning on it?

A: I’ll give you a good example of this. I am assuming that your experience was during the storms we had near the end of August. One of them produced a 66 mph wind gust at Brazos Bend State Park (from a CenterPoint sensor actually!) at 5:10 PM on August 21st.

A rather innocuous looking storm that produced near 70 mph winds on August 21st at Brazos Bend. (RadarScope)

Looking at radar, I’m not especially close to issuing a warning on that storm based on what we see above. One issue with Houston is that we are such a sprawling city that we actually have some pretty healthy data gaps when storms push through the area. Radar is critical, but it is also imperfect sometimes. Even the higher resolution and slightly closer Hobby Terminal Dopper Weather Radar showed winds of only about 35 mph in the above example. No indication whatsoever that this storm is producing 60 to 70 mph winds, but it is.

So there are instances where storms can (literally) fly under the radar. The radar beam up your way is shooting up to around 3,500-4,000 feet above the surface. So there is a chance that in those cases it was missing what was occurring closer to the ground.

It’s also not granular in time, either. Periodically, something will happen with a storm where it does its dirty work over the course of a minute or two, and it could happen in between the 2 to 4 minute radar scans we often get. Also, storms here tend are often what we call “pulse” storms: They ramp up quickly and ramp down just as quickly. You can literally go from a shower to a 50 mph hail-producing storm in the course of minutes. If I am correctly recalling the day you’re discussing, those storms were in fact remarkably quick to rev up. NWS did issue warnings, but there was a bit of playing from behind going on because of the nature of those types of storms.

But the reality is that until we get to more substantial radar coverage at more granularity than we’re currently capable of right now, there will occasionally be a miss like this from time to time. It’s the nature of uncertainty. It’s also a good reminder that if you see something, report it! Send it to us, the NWS, or your favorite local meteorologist. We’ll try to make sure it gets to the right people.

–Matt