Welcome to the April 2026 edition of our occasional SCW Q&A series. This version features one of our most-asked questions: What can we expect from the forecast El Niño coming our way?
Got questions of your own for future installments? Drop them in the Weather Talk category on our Discourse forum, at the Contact form on the blog’s homepage, or in the comments on this post.
Q. What is the expected effect of the predicted super El Niño (predicted to be the strongest in 150 years) on the Houston area for this summer and going into 2027? Will we see more rain? If so, when will such a pattern start? It seems we have been so dry for 4-5 years now.
A. We are now reasonably confident that El Niño will develop this summer, and strengthen as we head in to this fall and winter. Whether it becomes a super El Niño, well, we don’t know for sure. But it is quite possible. As for this summer there probably will be some tailwind effect pushing temperatures upward (we are already expecting a moderately warmer than normal summer). I am also hopeful that a developing El Niño will suppress some hurricane activity this season. We’ll have more to say about that in the coming weeks, but at this point it does not look to be a super-active season.
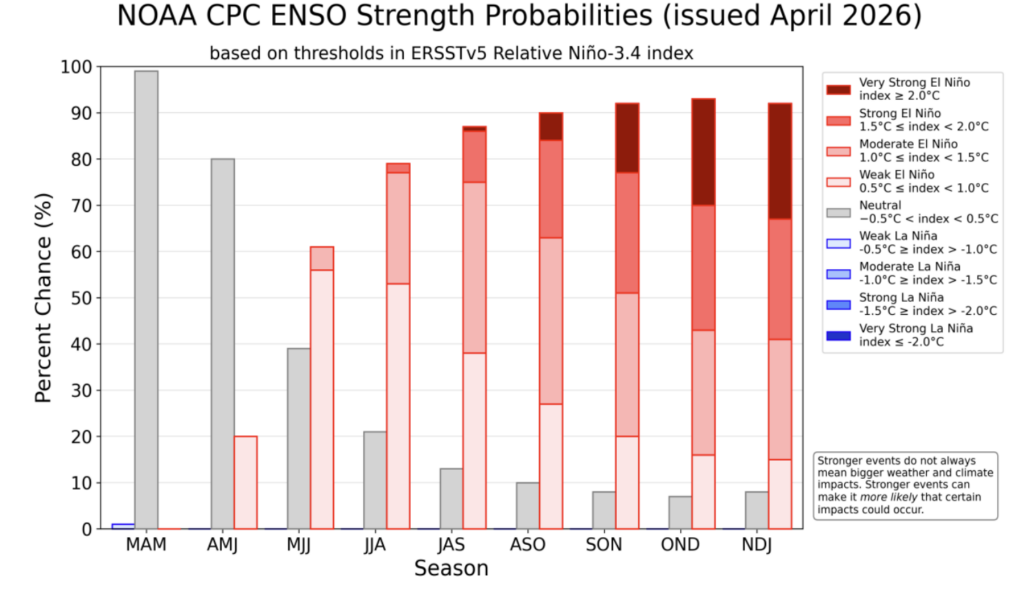
Then, as we get into the fall and winter, my sense is that with a strong El Niño in place we could see a reasonably wet season. However this is far enough into the future that I’m not sure we can really be confident about that. Unfortunately, what I am fairly confident in is that, should we get a super El Niño this summer and fall, its impacts will linger into 2027. This is likely to make for a very hot year for the globe, including summer in Houston next year.
– Eric
Q. I have always wondered what a capping inversion is. It seems to happen fairly often.
A. It does indeed! We often refer to a capping inversion on Space City Weather, but don’t always explain what it means. The concept is quite simple. For showers and thunderstorms to form the warm, moist air at the surface needs to rise several thousand feet and form clouds. If there is warmer air aloft in the atmosphere, this acts as a lid and prevents air from rising. (There’s a nice National Weather Service video showing this in practice on Facebook). This is the “cap.”
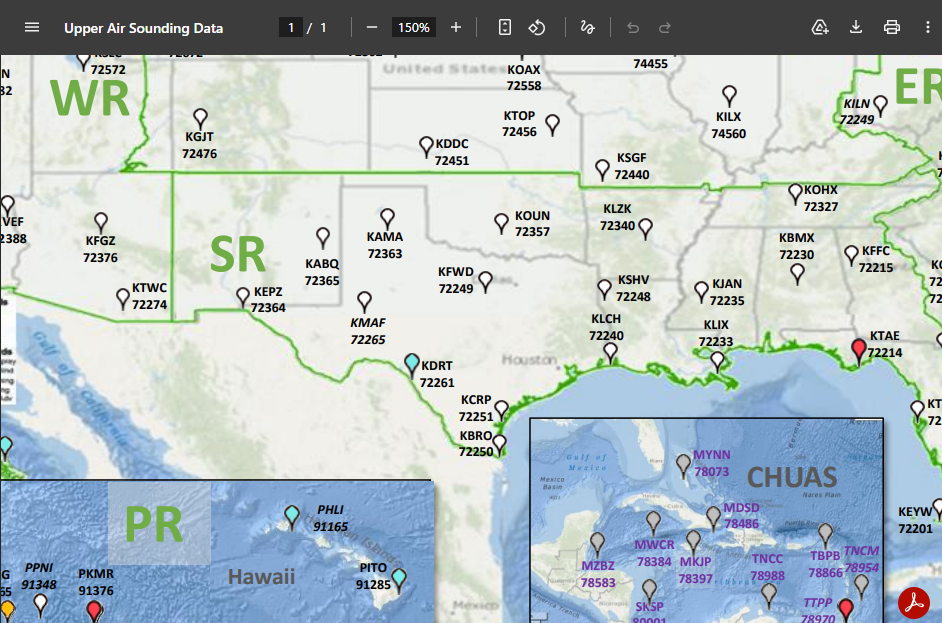
Atmospheric “soundings” are a really useful tool for meteorologists to get a vertical profile of the atmosphere, allowing us to determine when there is, and is not a cap. Unfortunately for Houston, there are a lack of good sounding locations (usually gathered by a weather balloon) nearby. Often times on a summer day, the difference between no rain and strong thunderstorms is whether this cap is strong enough to hold on, or erodes throughout the day. This lack of good nearby soundings is another reason why forecasting rainfall locally in Houston is a challenge.
– Eric
Q. I have no meteorological background and am basing this purely off observation but over the last couple of years, or longer, it has seemed that there has been significantly more rainfall in the northern part of Houston/Woodlands/Conroe than in the southern, specifically in the greater SW Houston. It’s almost as if I-10 has some kind of invisible wall. I’ve lived in the greater Houston area my whole life, the last 16 being in Sugar Land. Is there any veracity to this observation or am I just jealous of not getting the rainfall I need for my lawn and garden?
A. I am sorry to say, my jealous friend in Sugar Land, that I believe it is the latter. I should say, I often feel the same way about the area of town I live in, southeast of Houston. It will seem like it is raining everywhere but my neighborhood and this feels very bad. But this, almost certainly, is bias. (For example, the next time it is raining at your house, check the radar to see who is missing out!)
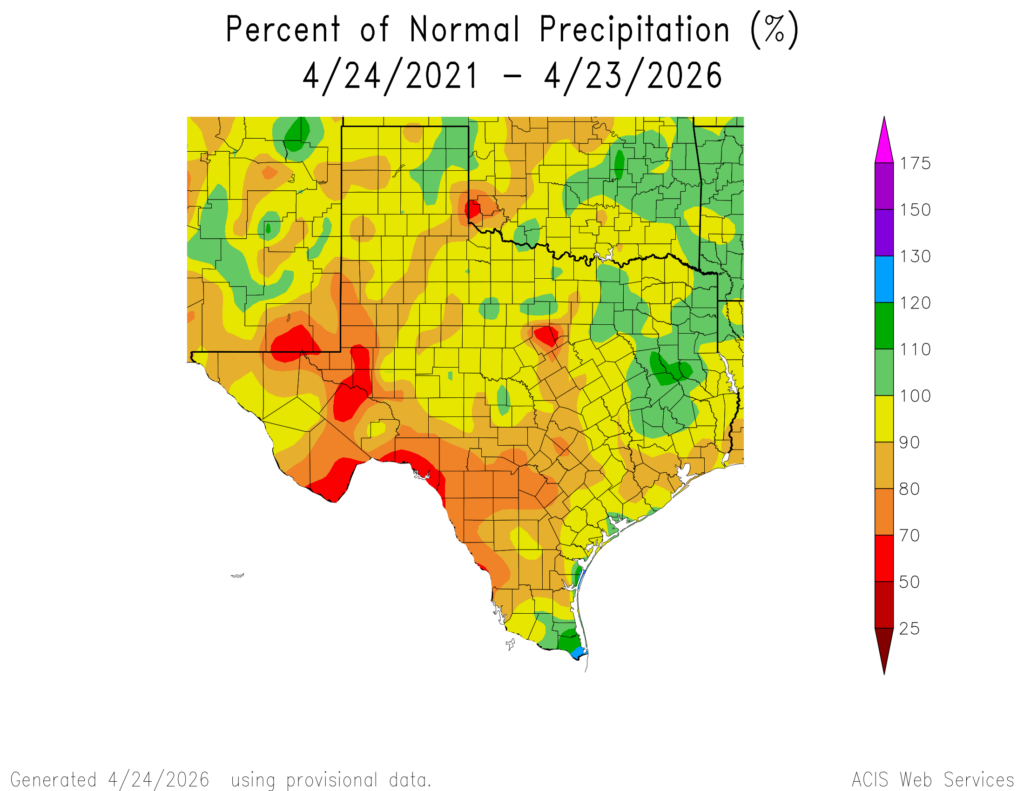
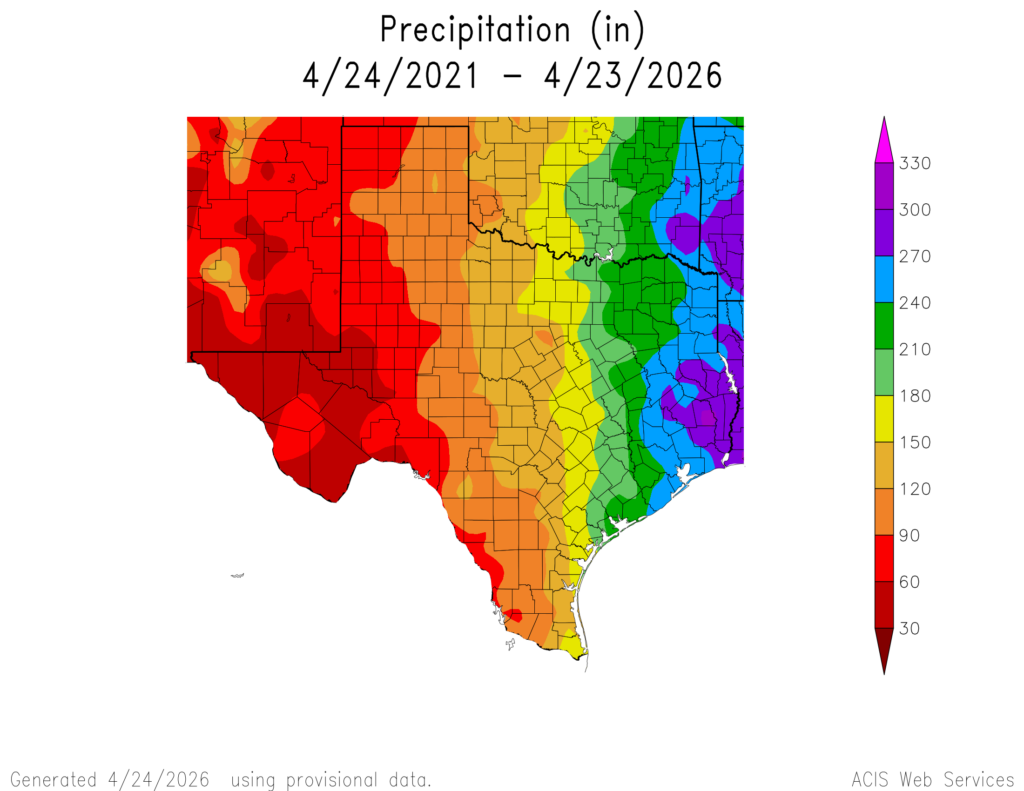
To put a little data to this question, let’s take a look at “percent of normal” rainfall totals for the state of Texas over the last five years. Basically, we can see, for areas from The Woodlands to Galveston pretty much everyone has received 80 to 100 percent of normal rainfall levels. If you squint the Fort Bend County has done a little worse than most.
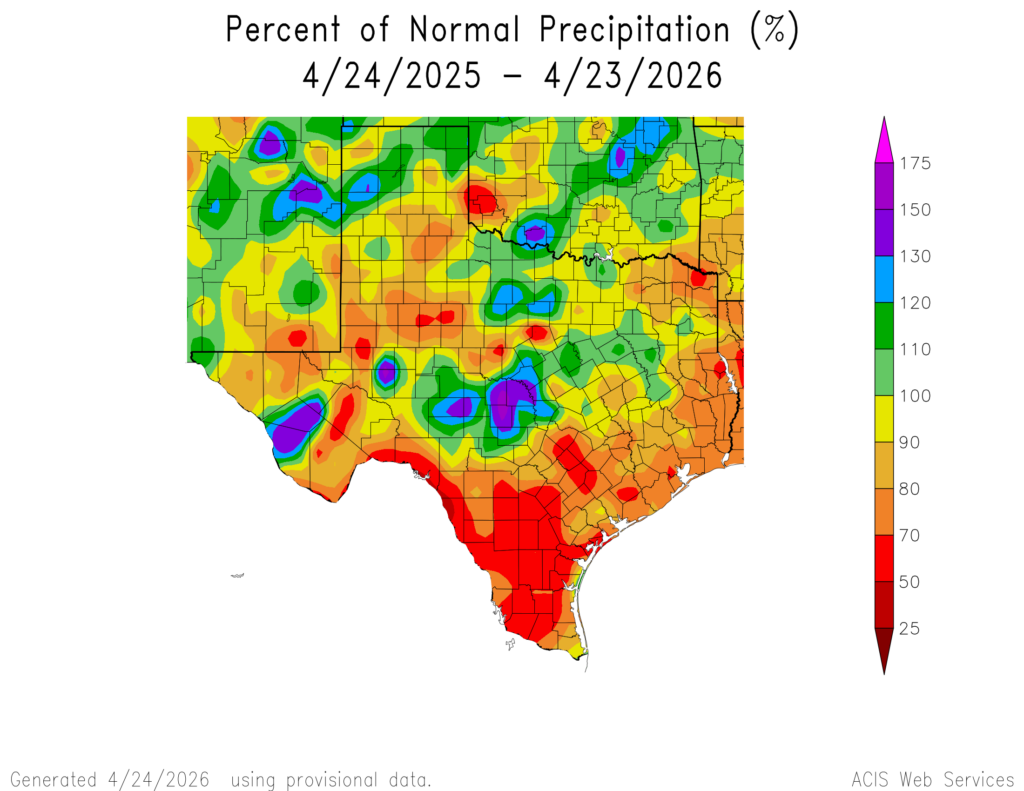
If we look at just the last 12 months, the story is pretty much the same. Areas north of Houston, generally, have gotten a little more rainfall on a “normal” basis compared to southern areas. But it’s not super significant and everyone has gotten a fair amount of precipitation.
Finally, let’s look at raw rainfall totals over the last five years (below). We can see that the real gradient in rainfall amounts is more of an east-to-west one rather than a north-to-south one. What this reveals is that areas west of Houston, including Fort Bend County, are climatologically a little bit drier than areas to the south and east of the city. This is primarily due to Gulf proximity. Anyway the bottom line is that all of this is mostly psychological.
-Eric
Q. Will the Gulf of Mexico ever cool down? And what would it take for it to cool down? Or will it never cool down until the next ice age?
A: The Gulf has indeed been running hot. Most global oceans have, but we’re seeing a little bit of easing back of that this year. Still, relative to what is the best normal we have from satellite data (since the late 70s), the Gulf is the warmest it has been.
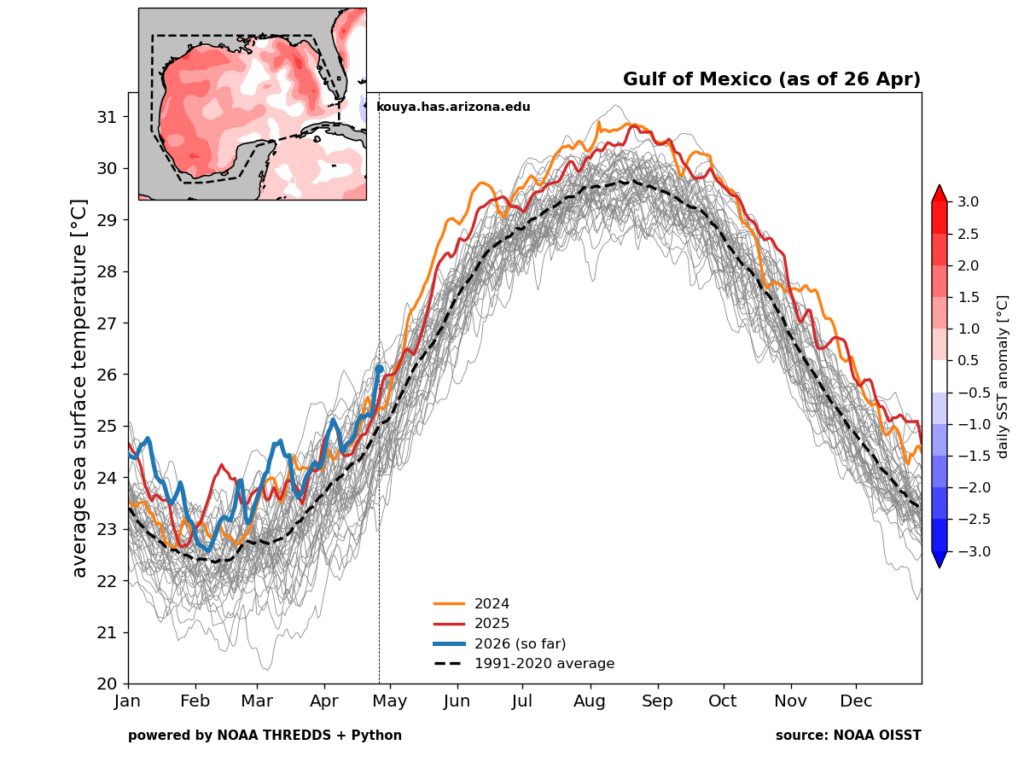
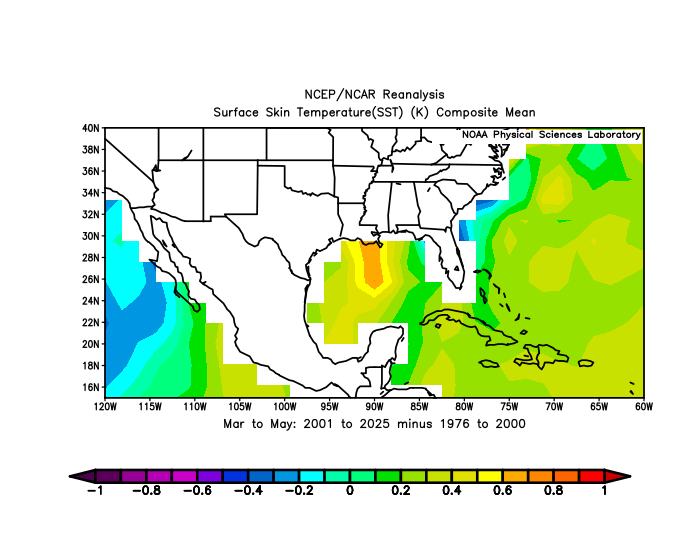
In the above chart from the University of Arizona, the blue line is in the middle of the pack for above normal water temperatures, but you can see that 2024 and 2025 were setting numerous daily records too. What we’ve sort of seen with the Gulf is a minor warming in the summer in the last 20 to 30 years but a more substantial warming in the fall, winter, and (as shown below) spring. Essentially what seems to be happening is that as our winters, springs, and autumns have warmed, the Gulf has not cooled off as much as we used to see historically.
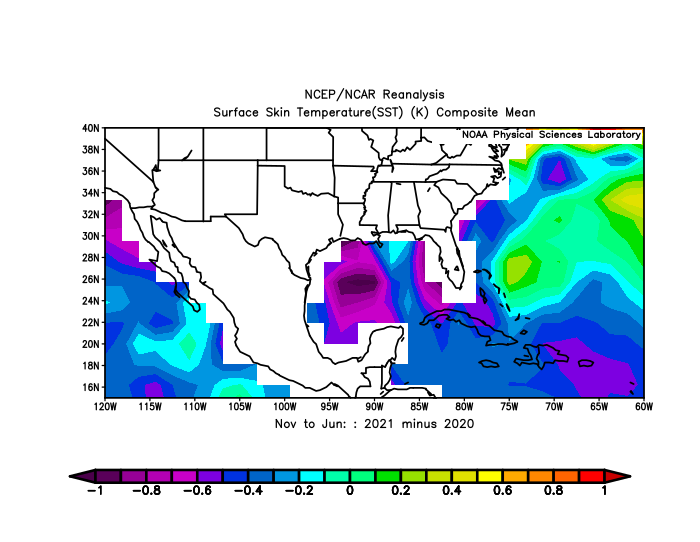
It pains me to type this, but what would cool down the Gulf of Mexico? The only two logical things that could do it are time or a very large and intense hurricane traversing the middle of the Gulf. Let’s take a look at the most potent Gulf hurricane season in recent memory: 2020. We’ll subtract the November through June sea surface temperatures from the following period (November 2020 through June 2021) just as an example. You’d expect the Gulf to be notably cooler. And it is quite a bit cooler.
But also keep in mind, the Gulf is a curious body of water with very shallow shelf waters and very deep offshore waters. The shelf waters are prone to a lot of fluctuations month to month and year to year, and they’ll respond more to how the seasons perform (colder winters –> colder shelf waters, etc.). But ultimately, what has happened is that the floor on how cool the Gulf can get has likely been raised due in part to climate change. I know a handful of readers don’t want to read that, but that’s the reality. And this is one of the clearest signs of climate warming there is in my opinion because of what has been observed with coral reefs in particular.
So the frustrating answer is that it’s probably going to be warm for a while, at least until we actually get a legitimately sustained cold winter in the Southeast, not just a couple one-off stronger events. Or until we have another active hurricane season. I hope it’s not the latter.
–Matt
Q. Why does it always seem to rain on weekends? Your forecasts for fronts seem to consistently show non-rainy weekdays, with fronts moving through over the weekend. I know weeks and weekends are human things, not nature, but is there some kind of cycle that causes this?
A. I love this question. Because it’s one of those things that sounds a little silly on the surface but people genuinely notice it and are curious. And the reality is actually quite nuanced! So on the one hand, there’s no single mechanism that says cold fronts are going to hit only on Saturdays and Sundays. Our bigger events happen any day of the week. The 1992 November tornado outbreak happened on a Saturday. The 2023 Pasadena tornado happened on a Tuesday.
But! There are a couple ways of looking at this that make chemical and meteorological sense. First, as we all commute to work and school and drive around during the week, our cars, our work, etc. leads to a build-up of aerosols in the atmosphere. Those aerosols act as nuclei in the atmosphere for rain drops to form on. Once you get to the weekend, those aerosols are at their highest amount of the week, and thus you’ve tilted the odds a bit.
Or so that’s what is speculated on in a 1998 paper. That one focused mostly on the Northeast urban corridor. A subsequent paper in 2010 also looked into this across the entire U.S. and found that there remains a weekend pattern signal even when you remove human (anthropogenic) influences. In other words, there may be a naturally occurring cycle at play. Additionally, a 2003 paper looked into temperature patterns that also found a “weekend effect” that exists. There was also a 2011 paper that noted hailstorms and tornadoes tend to be less frequent on weekends.
But a lot of scientists have also poked holes in this research question, speculating experimental flaws, cognitive biases, etc. The reality is, we just don’t know. But here: I decided to look at Houston’s total rainfall since 2023. 38.72 inches fell on Saturdays and Sundays. 109.18 inches fell on weekdays. About a quarter of our precip since January 2023 has fallen on weekends, which makes up about 29 percent of the week. You could say I’m cherrypicking data here but at least in the last few years, there’s no statistic “weekend effect” in Houston. Still, there’s enough there there in some cases to continue researching the topic!
-Matt
Q. What should I be doing now to prep my home to get ready for summer and better manage my energy costs?
We’ll toss this one to our sitewide partner, Reliant, to weigh in.
A. With warmer days already settling in, now is a smart time to tackle quick home fixes that can improve efficiency and help limit cooling costs as temperatures continue to rise. Plus, as AC use ramps up earlier in the season, small, smart energy choices can help keep homes comfortable while managing monthly bills. Here are a few simple, cost‑conscious tips:
- Inspect ductwork for loose connections or damaged insulation as leaks can waste up to 30% of cooled air.
- Add more insulation, which is a critical component of home energy efficiency and can be among the most cost-effective improvements you can make.
- Replace or clean air filters every 30-60 days, as a clean filter can reduce AC energy consumption by up to 15 percent.
- Schedule a spring tune‑up to ensure the AC system is ready for high demand.
- Follow the 4×4 rule by raising your air conditioning temperature 4 degrees if you’ll be away from home 4 hours or more.
- Get ahead of the summer heat by investing in a smart thermostat, which helps make managing your home’s energy effortless and can lead to real savings when temperatures climb.
-Reliant