Parts of Houston will approach triple digits today. Also, we have an exciting announcement to share

In brief: In today’s post we reveal the new design and content for our flood scale. We have made changes based on research conducted by the University of Houston. Although rain chances will increase later this week, we also anticipate no need to use the new flood scale any time soon.

Updated flood scale

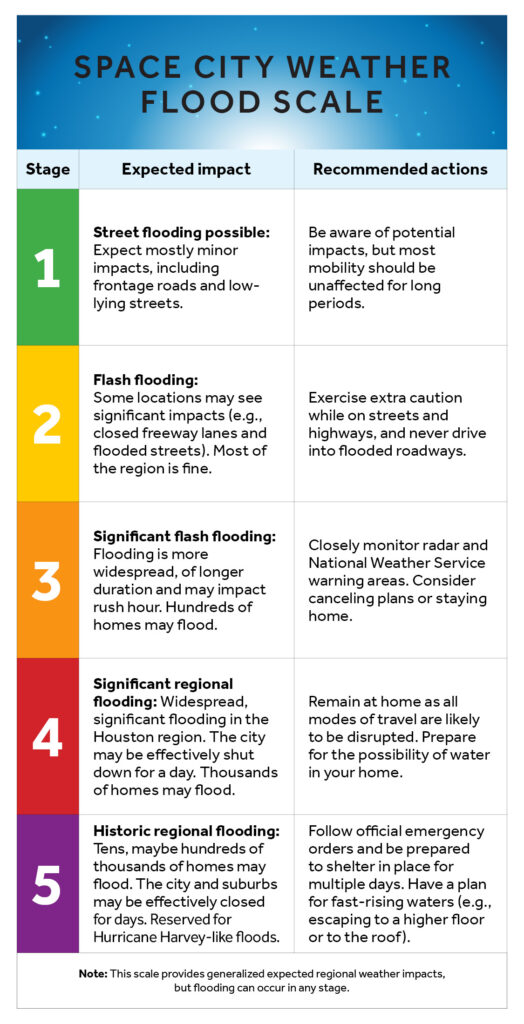
This morning we are pleased to announce an update of our flood scale, which is intended to help guide expectations for people in the greater Houston region when it comes to the potential for flooding. We first introduced our flood scale in 2019, after Hurricane Harvey, and have used it dozens of times since then. But we really did not understand how people were using it.

Now, with the help of some researchers from the University of Houston, we do. A professor of
Psychology, Steven Paul Woods, reached out to Matt a couple of years ago, and together they and one of his doctoral students, Natalie C. Ridgely, worked to perform a study of the scale and whether it was effective at communicating risk. Later this morning we will publish a summary of the study, and its results, written by Woods and Ridgely. (Here it is).

As a result of this study, we have made some changes in the structure of the scale to simplify it, and added recommended actions. Reliant provided a cleaner design. What thrills me the most is that this scale was created here in Houston, and improved by local researchers who care about this community just as much as we do. It is by Houston, for Houston.

Our new scale appears below:

Tuesday

Well, we won’t need the flood scale today. With high pressure firmly in place, Houston is going to have one of its hottest days of the year. With sunny skies, look for high temperatures to push into the upper 90s across most of the region away from the immediate coast. Some inland areas may reach 100 degrees. Winds will be very light, from the west mostly. Lows tonight will only drop into the upper 70s.

Wednesday

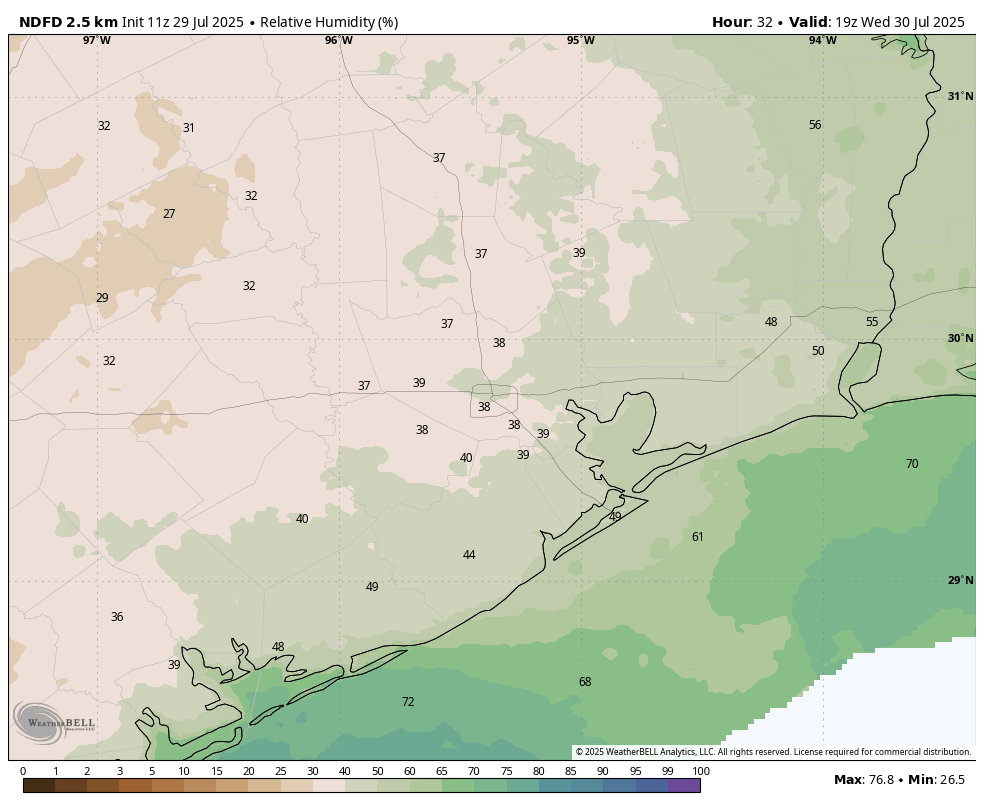
This will be another hot and mostly sunny day, with highs in the upper 90s. However there will be a couple of subtle differences. One is that dewpoints may drop into the mid-60s across the region. This is not “dry” in any great sense, but these dewpoints are lower than normal for this time of year. So humidity will be lower than we have been often experiencing this summer, especially for inland areas. There also will be a very slight chance of showers later on Wednesday afternoon or evening.

Thursday and Friday

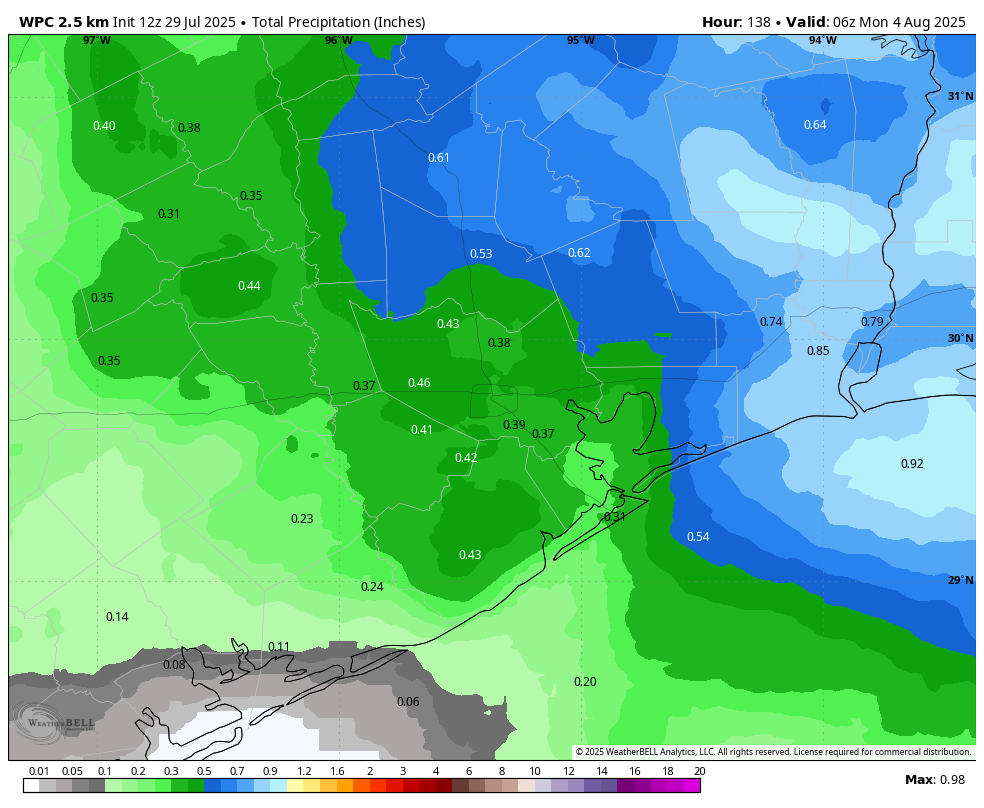
Low pressure stretching across the Gulf will bring increased rain chances into the area for several days. On Thursday and Friday the likelihood of rain will be somewhere between 30 and 50 percent, with low-end accumulations for most. Depending on the timing of rain (if any) highs will vary between the low- and upper-90s, with partly to mostly sunny skies.

Saturday and Sunday

Better rain chances will arrive this weekend, with both days bringing about a 50 percent likelihood of showers. For now we don’t see too much of a risk for really heavy rainfall, and my expectation is that most locations will pick up between 0.25 and 0.5 inch of rain. Since this is summer and tropical rainfall is possible, we’ll be on the lookout for higher totals, but for now this looks more like a splash of rain rather than a deluge. Highs will generally be in the low- to mid-90s with partly sunny skies.

NOAA rain accumulation forecast for now through Sunday. (Weather Bell)

Next week

The first full week of August does not look to be excessively hot. Temperatures probably will be in the mid-90s for the most part, with a smattering of daily showers driven by the sea breeze. Beyond that, we shall have to see.

37 thoughts on “Parts of Houston will approach triple digits today. Also, we have an exciting announcement to share”

  1. FYI app isn’t launching. It tries and can see today’s post for several seconds then shuts down. I’m an Apple phone iOS user.

    Reply
      • I have the same problem with the app. I did try deleting and reinstalling. It worked for a short time but then went back to crashing shortly after starting.

        The notifications problem does seem to be fixed, though 🙂

        Reply
    • We don’t use iPhones anymore, but you might have a similar feature, as our Android (Samsung) phones have.

      Go to Settings, then Apps, then choose the app (SCW in this case).
      Next, we choose “Force Stop”.
      Then we tap on Storage and Clear Cache.

      Sometimes the app’s Cache becomes corrupted. Afterwards, exit Settings and start the SCW app again.

      This saves uninstalling and installing again (which we’ve never done, with any app).

      Reply
  2. Thanks for developing the flood scale. Please send it far and wide across the state and country. Every one will find this useful.

    Reply
  3. Love the new flood scale. It is so much clearer to me. Since Harvey the word “flood” causes some anxiety, I feel that this new research, better definitions of impact and what actions should be taken will ease some of the anxiousness. Thank you to everyone who clearly cares about our community.

    Reply
  4. Houston has great weather resources in Space City and The Eyewall. Thank you to everyone who works so hard to make sure we are well informed.

    Reply
  5. This new flood scale is wonderful. I like the more thorough explanations and advice on what to do next. There are always people who are new to flood situations, so having any good, realistic advice about how to handle it is helpful. Thanks to all who worked on developing it!

    Reply
  6. The only thing I see at a quick read through is that specific mention of rush hour is Stage Three — I trust we don’t jump from Stage One to Three just because of timing of an event. Thanks for your efforts!

    Reply
    • Rush hour does matter, traffic is so heavy, people get stuck in a spot where the water tends to rise and get flooded. Also makes it harder to reroute existing traffic.

      Reply
  7. Thank you for the flood scale; I like that at stage 3, you recommend to consider canceling plans.
    I remember that first outer band from Harvey; it dumped some rain, and I thought, wow, that wasn’t very bad. And I think a lot of others thought that, too. They went out to watch the Mayweather fight, and sadly this was timed perfectly with the start of the torrential downpour. On my street, there were a dozen abandoned cars, and from my apartment in Meyerland I could see a hundred cars and trucks stuck on 610 for days.
    Safety first!

    Reply
  8. I’d add reference to specific streets / freeways eg Stage 1 = Weslayan flooded north of Bissonnet, etc.
    Looks great!

    Reply
    • I’ve wanted an online map that includes this information since I moved here, many years ago. It would need to be constantly maintained because the usual locations change over time. I currently use Google map traffic and guess based on traffic, but obviously that isn’t 100%.

      Reply
  9. The new scale is much improved, especially since each level is not tied to a historic event which I think limited it’s use in the past. It’s hard to predict the damage future rain events will bring and even harder to preemptively compare it to a previous event.

    I wonder if it makes sense to reduce the number of levels to the flood scale given I don’t recall too many times stage 3 and up were utilized (thankfully!). Perhaps a 4 level scale would be sufficient.

    Reply
  10. The new scale is much improved, especially since each level is not tied to a historic event which I think limited it’s use in the past. It’s hard to predict the damage future rain events will bring and even harder to preemptively compare it to a previous event.

    I wonder if it makes sense to reduce the number of levels to the flood scale given I don’t recall too many times stage 3 and up were utilized (thankfully!). Perhaps a 4 level scale would be sufficient.

    Reply
  11. I appreciate the updated risk scale. It’s more detailed in what to expect and also not to overreact when a flood threat ls expected. I do miss the historical example in each stage. This threat is comparable to Tropical Storm Allison, for example.

    Regardless, a useful tool around these parts.

    Reply
  12. Thank you so much for taking the time to update the flood scale. I remember most of the prior events in your prior one, but memory does fade with time. This new one is terrific!

    Reply
  13. hell yeah I just want to give a shout out to research like this – congrats to you all and to Dr. Woods and Natalie for doing this study! Especially prescient with everything that happened earlier this month in the hill country 🙁

    THIS IS WHY RESEARCH FUNDING IN THE SCIENCES IS SO IMPORTANT!!!! (this shouldn’t be a controversial statement!!!)

    Reply
  14. I came to complain about your new flood scale — specifically, the removal of the historic flood events.

    HOWEVER, I saw your page with in-depth descriptions of historical flood events and flood stage levels, and that’s much more informative than what will fit into a single chart.

    I recommend you make a clear reference on the chart back to the historical flood stages on your website.

    And thanks for all you do!!!

    Reply
    • Agreed. Until I came to your comment I would have had no idea they kept some of those references with even more detailed information. Those prior events give me more information than the updated charts—but maybe only because I’ve lived here all my life and remember them.

      Would definitely recommend at least a link at the top or bottom of the new chart to let us know that information still exists.

      Reply
  15. I love the new flood scale. Not sure why you need a stage 5. You will never forecast a Stage 5 without having it begin as a 3-4 as the storm is evolving in real time.

    Reply
  16. With only one rather odd 100 degree reading year to date I’m counting our blessings. If we can get through the next 30 days without too much pain it’s all downhill until Autumn. This time of year I consider anything 95 or below a win!

    Reply
  17. 74 this morning in League City area. That’s actually nice and perfect for a late July morning. Been seeing 74-75 past few weeks as well. That compared to 78-80 is a world of difference. All about the Dewpoints.

    And folks thinking about fall is just weird. It’s July 29th. Summer is just now kicking off. All 31 days of August folks. And September at least half of that month has to come. Most of September will be hot.

    And August and September is prime time for hurricane season for this area. Get your heads outta the gutter.

    Reply
  18. I was traveling last week. Somebody asked me what the weather is like here. I hesitated because the weather here is difficult to describe other than really hot and humid in the summer. Not unusual. But I think it rains infrequently. Almost desert-like at times. When it does rain, it’s a lot. That’s unusual and unexpected given the location. Growing plants that need regular water is a chore. This summer has been different for sure. How would others describe it in a quick sentence?

    Reply
    • The weather in Southeast Texas is like a very bi polar person who is not taking their meds. Thats the shortest sentence I could think of.

      Reply
  19. It is appropriate that your new Flood scale was released on July 29. On this date in 1969, Tropical Storm Claudette dropped 42 inches in 24 hours in Alvin. I believe that this is a record for the mainland.

    Reply
  20. I am not sure the advice on Stage 5 is wise, like going to the roof. My understanding is that people have done this during major floods and been trapped in the attic. Honestly, the recommendation should probably be evacuate beforehand if in low lying areas or for stage 5, even in the 500-year flood plain.

    Reply

Leave a Reply. URLs require moderation.