Welcome to the March SCW Q&A, where we tackle your questions about the weather, climate and how things work around here. You can submit your questions via the Contact link on the blog home page, or by leaving a question in the comments below.
Let’s get to it!
Q: Can you settle a bet for me? My friend and I have been arguing about whether it has been getting warmer sooner in Houston. He’s lived here 30 years, I’ve been here 20 years, so we both think we know what we’re talking about. I say it’s gotten warmer sooner, he says no. Do you have data to prove one of us is right? Preferably me?
A: We here at Space City Weather do not condone gambling, but in this instance, we will make every effort to ensure a victor is decided. So I guess the first way to go about this is to ask, “What is ‘warmer?'” What’s our definition? Are we talking first 80 degree day? 90 degree day? Last 40 degree night?
Let’s start with 80 degree days. The date of our first 80 degree day of the year has been steadily increasing over the last 50 years.
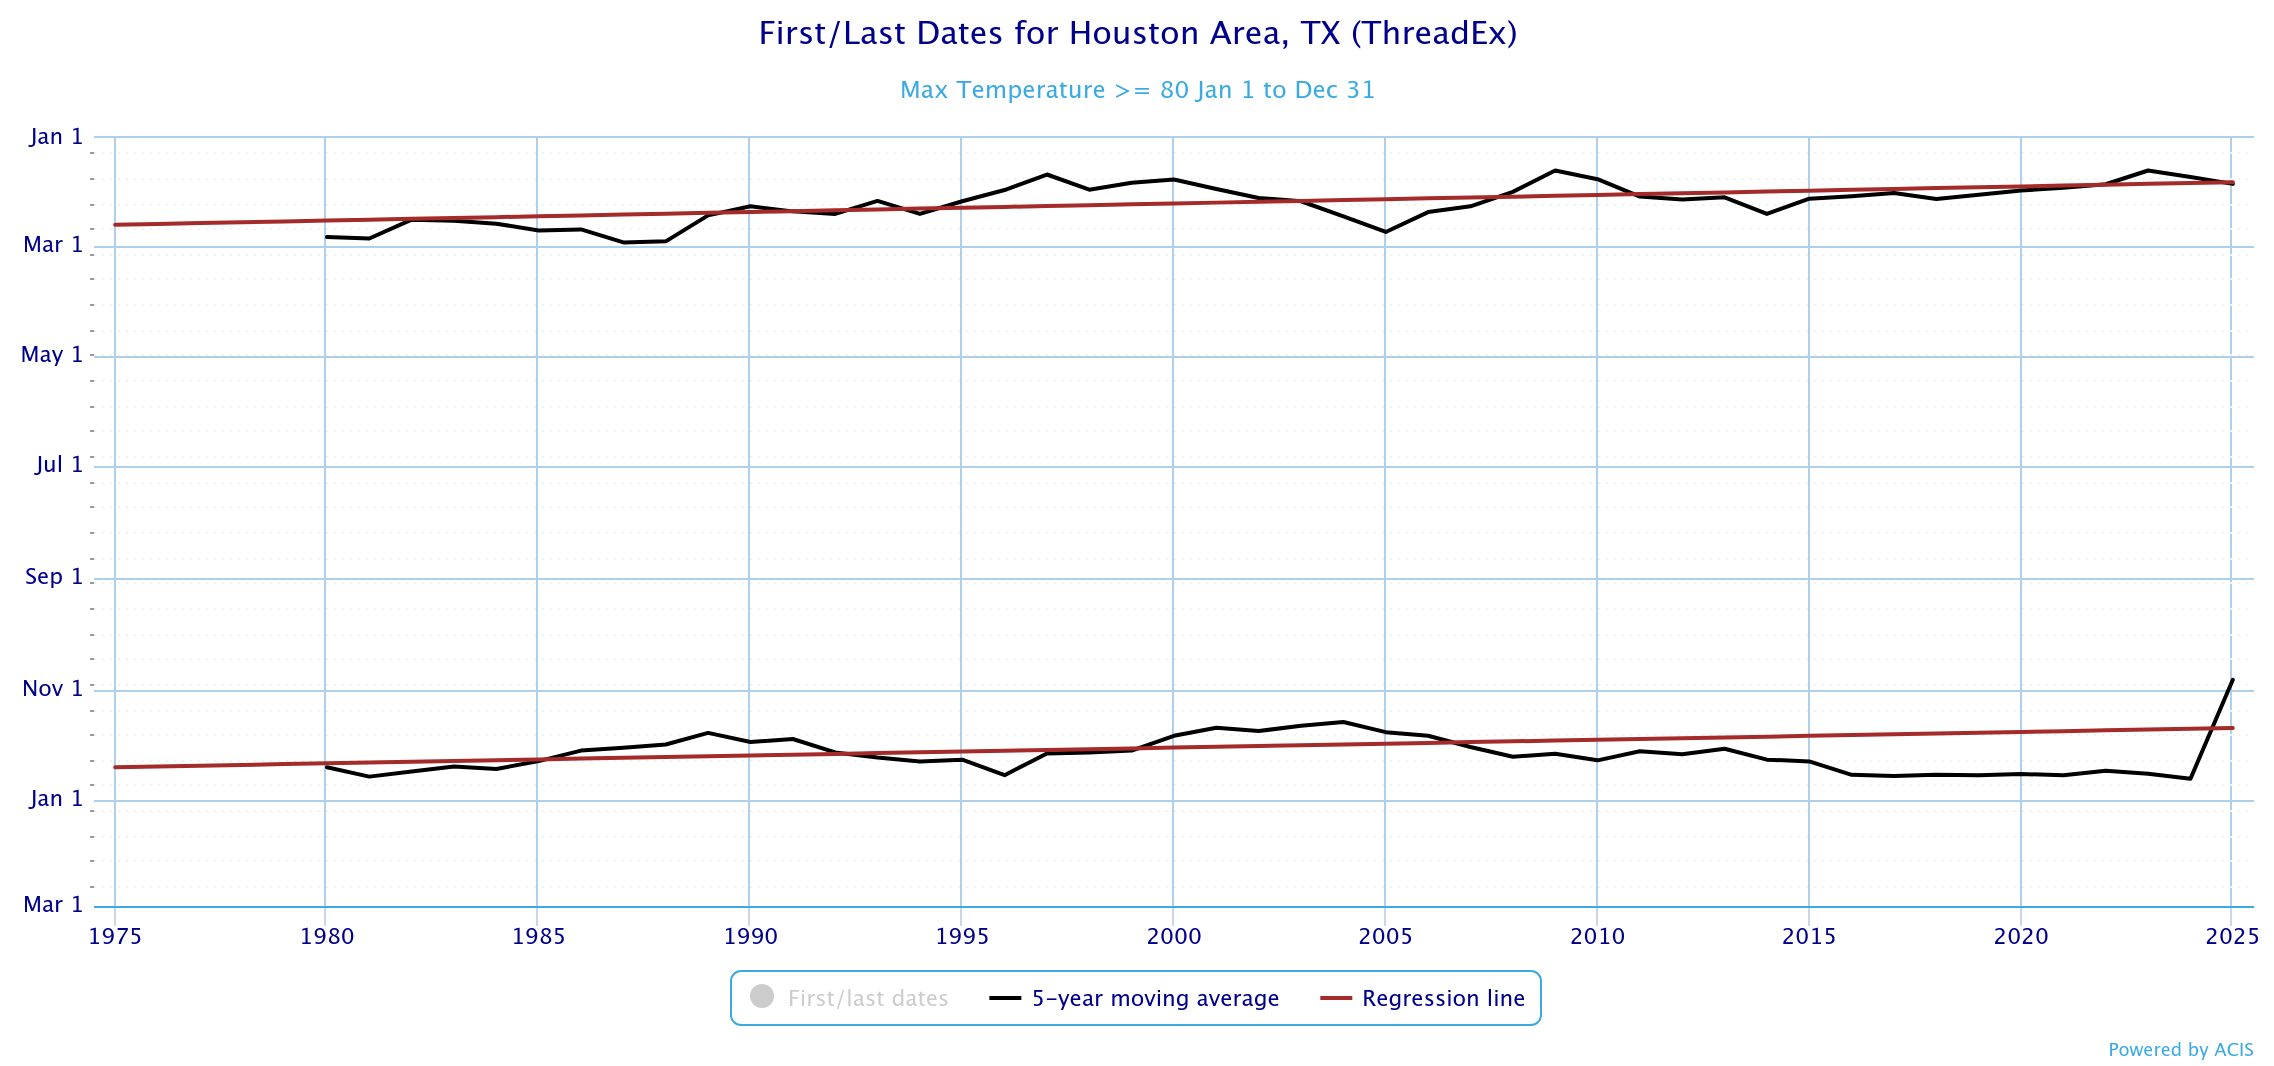
In 1975, the average first 80 degree day would have occurred around February 18th. In 2025, that has moved up by over 3 weeks. For 90 degree days, it has similarly advanced forward, with the average first 90 degree day occurring around May 8th in the 1970s to mid-April today. Our last 40 degree night? In the 1970s it was April 28th. Today, it’s April 13th.
So, yes, reader. It’s not your imagination. Even if we look at this in several other ways, it has been getting warmer earlier in the year, especially in the last 30 to 50 years here in Houston.
–Matt
Q: I was wondering about long range weather forecasts. When you say there is a strong signal that a cold front or other weather event will happen 7 to 10 days out, what is the signal? Is it just a lot of data points that the models see as a pattern, maybe that it recognizes?
A: The signal is just our Spidey senses tingling. No, but seriously, this is a good question. When we’re looking out in more of the extended timeframe, we obviously don’t want to portray any degree of overconfidence in a possible forecast outcome. But not all 7 to 10 day forecasts are created equal. In some cases, you will get really good model agreement on an outcome. In other words, we’ll look at several key weather models like the GFS and European models and their ensemble means (when they’re run 30 to 50 different times with some tweaks and averaged together), and also some AI models now. If most of them agree on strong high pressure (warm and dry) or a very stormy pattern, we can say with some degree of confidence that there’s a “signal” for warmer or wetter weather. Or vice versa.
Now, there will be instances where confidence in an extended range forecast is even lower than usual.
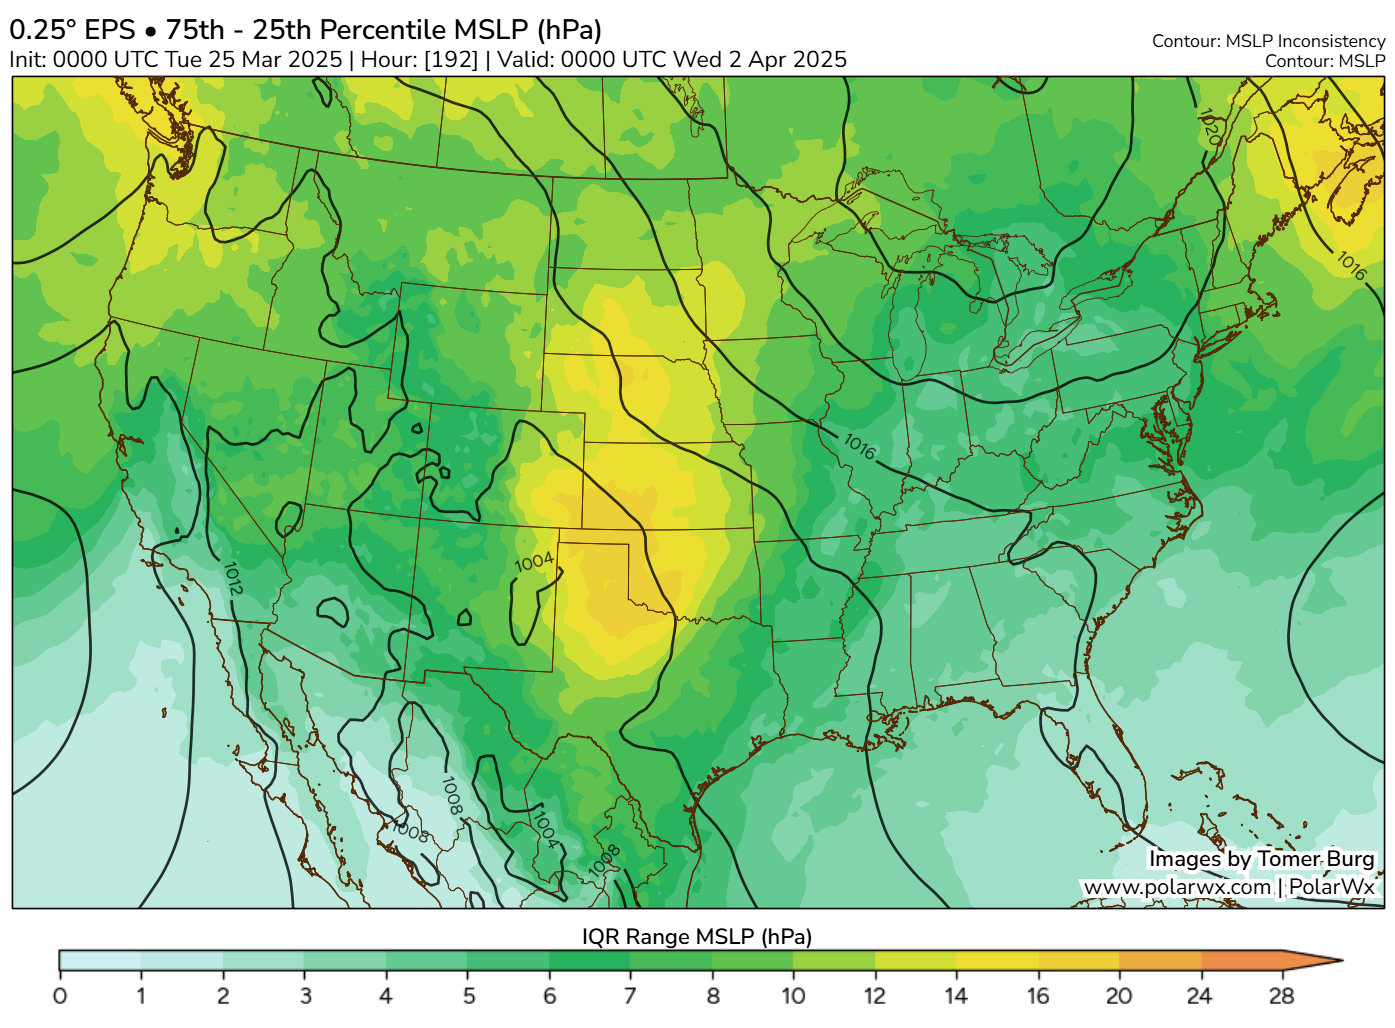
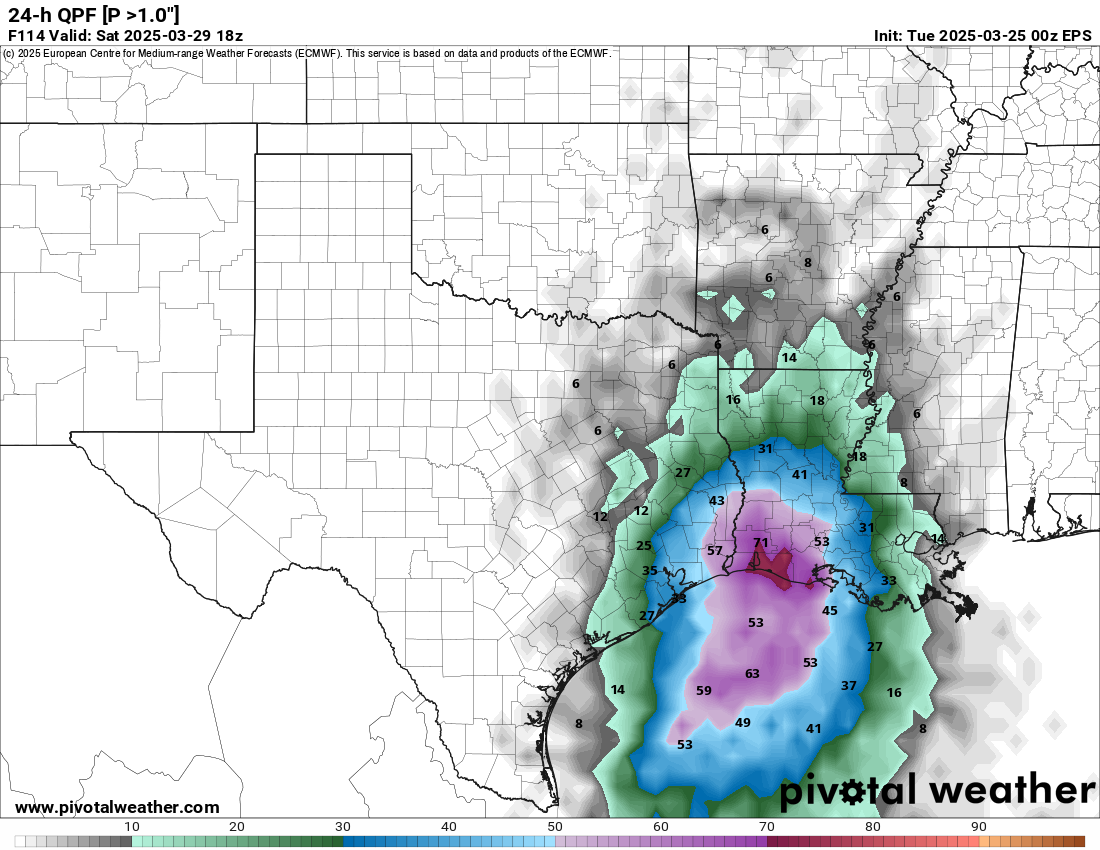
For instance, placement of low pressure is one that is often challenging. We may know there’s a good signal for a storm at a certain timeframe, but we may not have any idea where that storm will emerge. From the image above, we would assume the Panhandle, but there is enough variability in exactly where that ends up that we have low confidence in any details.
So the bottom line here is that every extended forecast is somewhat unique and some periods will have slightly higher confidence than others. One other element that comes into play? Forecaster experience. I spent most of the last 15 years in energy trading environments working on day 10 and longer forecasts, and one of the most critical elements in trying to determine whether temperatures would trend one way or the other was just experience. You can’t track a specific metric to quantify that, but it counts for something.
–Matt
Q. Was this winter more grey than usual? It’s felt especially dreary the past couple months but I don’t know if it’s more cloudy days than usual!
A. Your intuition is good! Let’s look at December, January and February, which is a reasonable definition of winter in Houston. As part of its daily summary, the National Weather Service tabulates (on a scale of 1 to 10) whether a day was generally clear, partly cloudy, or cloudy. Here’s the total number of such days for this winter over the three-month period:
Clear: 19 days
Partly Cloudy: 39 days
Cloudy: 32 days
So by this tabulation, only 21 percent of days this winter were clear, or mostly clear, whereas 43 percent were partly cloudy, and 36 percent were cloudy. Historically, during winter, the split is just about even in Houston, with one-third of days being mostly clear, one-third partly cloudy, and one-third mostly cloudy. There is some subjectivity in measuring cloud cover across an entire area, so we can’t put too fine of a point on things. But yes, I think it’s safe to say this winter was more cloudy than normal in Houston this year But don’t worry, spring is often one of the sunniest times of year!
-Eric
Q: I am reading about mass firings at NOAA. Of course, this concerns me since we live in a hurricane prone area. What can I do as a concerned citizen? Is this situation going to affect your forecasting?
A: So there were a number of firings done to probational employees recently. Unfortunately that took out a number of experienced forecasters and researchers as well as a number of incoming younger talent. The whole thing is tied up in litigation, and some people have been hired back, others hired back and assigned to desk duty.
No matter how you view the issue, it’s really just a mess. In addition to this, a number of employees took the “fork in the road” buyout offer, and additional buyouts are expected to be in the pipeline. This has led to staffing reductions, including here in Houston where our meteorologist in charge, Jeff Evans recently departed. Between the cost-cutting and staffing reductions, we are beginning to see weather balloon data get cut now. On most days, you aren’t going to notice much or any of this. But a couple things are true: Over time, weather forecast quality is going to slowly degrade and during major events, particularly hurricanes, we may begin to notice more significant deviations from forecast because of glaring holes in the data. And this is in a world that assumes no further cuts which seems unlikely. Yes, this will impact our forecasting.

We have already written about our thoughts on keeping NOAA whole. Given the degree of success the NWS and NOAA have had in saving lives, protecting property and positively impacting the economy as a whole, the cost vs. benefit of cutting this agency may actually work against the implied goal of cutting government spending and reducing waste. In other words, these cuts would almost certainly be counterproductive and not work to achieve the stated goals of the current administration. I’m not just saying that as a result bias; the ROI of NOAA is actually remarkable and an example of a government agency being successful in ways that other government agencies should strive for. And in a place like Houston, which is the most disaster-prone region in America, we should be the ones screaming loudest to preserve it wholly.
So what can you do? Start by calling your congressional representative and explaining this. Feel free to cite our work on the matter. Educate and inform friends and family. Encourage others to speak up about it. Attend town halls with representatives. There are about eleventy billion priorities for both conservatives and liberals right now, but this is one of the rare ones that should enjoy strong bipartisan support and be non-controversial. If you need to cut debt, you don’t just take an axe to everything; you try to target your cuts to achieve the maximum cost savings with least collateral damage. And broad cuts to NOAA runs against that philosophy.
-Matt
Q. I followed your instructions from back in January about how to fix the problem of not getting notifications from your app on my iPhone, and it worked for a while. I deleted it, reinstalled it, and for a couple of weeks, notifications flowed – until they didn’t. I deleted again, reinstalled again, same thing. What’s going on?
Q. Recently, I quit getting your daily email with the latest blog posts. I’d been getting this regularly for a long time but it suddenly stopped. I re-entered my address in the field on the blog’s home page, but that didn’t help. Eventually I used another email address and that worked, but I’d really rather have your latest forecasts come to my regular address. Help!!!
A. There’s a great line from a classic Paul Newman film, 1967’s “Cool Hand Luke”: “What we have here is a failure to communicate.” It fits for us, as two of the ways we get our forecasts out are failing to communicate with some of you. For one, a real fix may be imminent. For the other … not so much.
The app notifications problem turned out to be caused by an old version of the platform our developer, Hussain Abbasi, uses to build and maintain the app. It doesn’t play nice with some of the changes Apple has made in the way notifications work in iOS/ipadOS apps, and he originally planned to move to a completely different tool next year.
But Hussain recently found that the newest version of the development platform actually will do the job, so he is in the process of updating the app with that tool. While it’s not going to be the full rewrite of the app that he’d planned, it’s still taking a while. We hope to have something for you soon. In the meantime, deleting and reinstalling the app will get you a couple of weeks of notifications. Because we don’t require a login, this is relatively painless (but still annoying!).
The email problem is tougher. Being frugal, we have been using the email system built into WordPress. It’s free, as in beer, and in theory it allows for an unlimited number of recipients. Except we have discovered that there is indeed a limit, and we appear to have it hit at 24,700.
What appears to be happening is that every time someone new signs up to get SCW emails, someone else in the email database gets kicked off the list. Re-entering your old address in the home-page form doesn’t help, but putting in a new address should. Of course, you might be kicking someone else off the system when you do!
The fix for us is to switch to a different email system, which we’d have to pay for, and given the number of users we have and the frequency of our emails, that would be very, very expensive. We continue to look at solutions for this, but for now, your patience is appreciated!
-Dwight
Re: cloudiness – I thought my solar panels were not generating as much as usual. Sigh…
Don’t worry it’s about to get hotter than a hoochies coochie so you should have plenty of sun coming through
Great answer on the government cutbacks. They are indeed moving too fast and too carelessly. If they don’t shape up, the Republicans may find themselves out of power for decades like they were after their non- response to the 1929 crash.
As Alan Jackson commented earlier, I too noticed less production from our solar arrays. I collect the data from the meter daily and regularly review the information from the monitoring app I use. We definitely had less sunlight this winter.
I always appreciate how y’all pretty much call it like you see it. That’s fairly unusual in today’s world unfortunately.
As to the weather getting warmer sooner, I’d have to ask the location of the gauges, whether rural or urban (or has it changed over the years)? Also has the gauges been replaced, updated, etc. ?
“Start by calling your congressional representative and explaining this.”
Matt, they are so far up Trump’s rectum they will not listen to common sense.
Regarding the email question, I have been wondering the same thing, so appreciate the answer. I stopped receiving the emails in my inbox a few months ago and was wondering what happened.
Sadly, starting to see issues with NWS postings already. No clue if it’s due to systems or personnel. For example, this week, an excessive weather outlook was for New Years – yes, dated December 2024. This morning (very early) the outlook was dated June 23, 2024 (as updated date). Was later fixed. The ones that were supposed to be for “tonight” outlook (last night) was that the NOAA radio was out instead. In fact, 3 of these had that when it was supposed to be one and updates on expected weather. Nothing lining up really. So, we need to follow you guys.
I follow the models for patterns and the radars for real time. Leaning on the ECMWF. Feels like we’re quickly regressing into the 1980s, only w a supercharged atmosphere.
And went & got a VPN. Get wx info from outside the US, still trying to learn how & hope it’s relevant.
So, conversely to the first question/answer. When is the last 90 degree day of the year, 80 degree day, or first 40 degree night in the fall? Are those moving back, the same , or forward?