In brief: Light to moderate showers are moving into Houston from the southwest this morning, and this more or less will be the pattern over the next two days. There’s a chance for some heavier rain on Friday afternoon or evening, but overall the threat for significant flooding in Houston and surrounding suburbs is fairly low. After Friday, our weather turns warmer for awhile.
Rain status
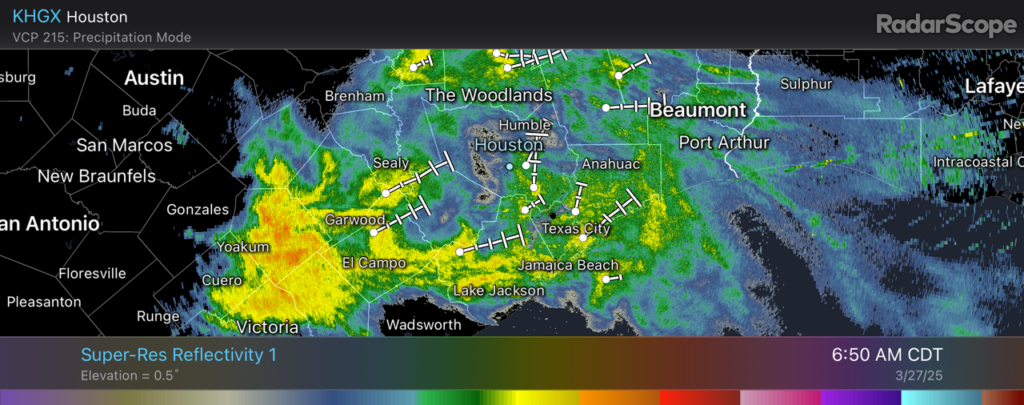
For a few days now we’ve been discussing the impending arrival of a disturbance in the upper atmosphere, and its potential to drop buckets of rainfall over the region. There has been a see-saw battle between global and regional weather models. Now that the rains have finally begun, the contours of this system and its impacts are finally coming into focus. Essentially, instead of seeing mostly heavy rainfall in the Houston region, we are likely to see mostly light to moderate showers over the next two days.
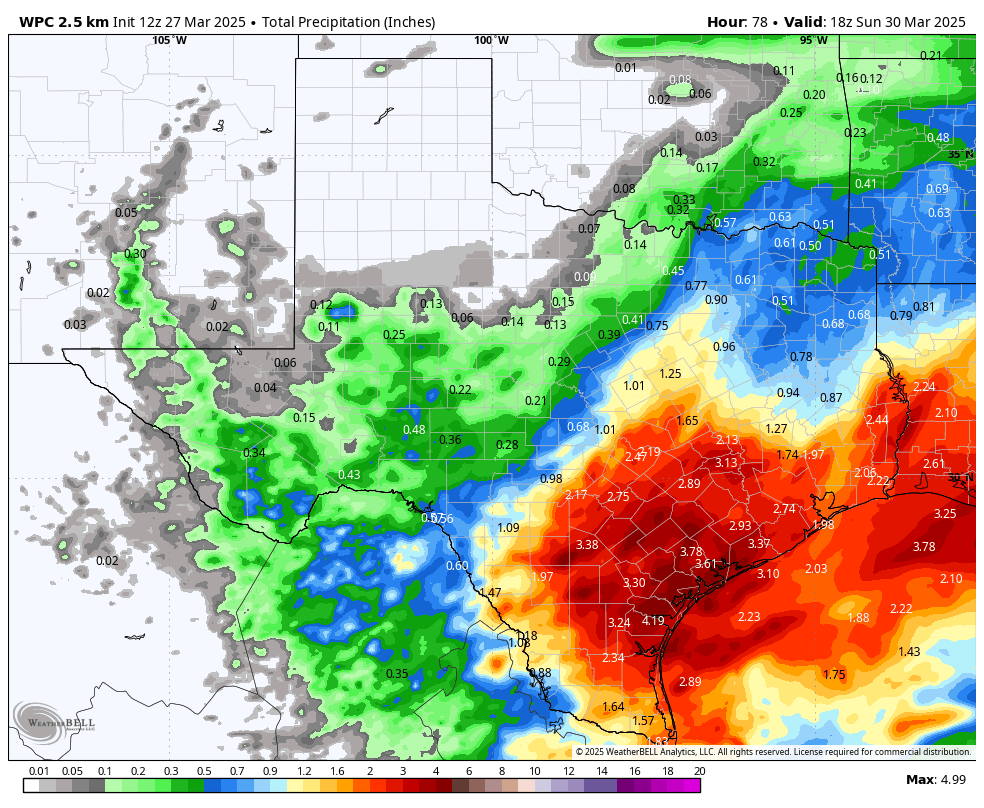
The one exception to this is locations southwest of the Houston metro area, including Jackson, Matagorda,
Wharton, and Colorado counties that have already received 1 inch of rainfall. Some locations within these counties may eventually pick up 4 to 6 inches of rainfall with higher totals. This is certainly enough to cause some street flooding issues. So areas southwest of Houston could get soggy. But as for Houston itself, we are probably looking at rain accumulations of 0.5 to 2 inches between now and Friday night.
I am going to leave the Stage 1 flood alert in place for areas south of Interstate 10 out of an abundance of caution, because at this time there should not be significant flooding or mobility disruptions in Houston and its suburbs.
Thursday
We are seeing light to moderate showers moving in from the southwest this morning, and these should be fairly persistent for much of the day. Expect on-and-off rain, with overall mostly light accumulations. Certainly there could be a few isolated thunderstorms with some heavier rain, but I don’t expect widespread issues. With cloudy skies, high temperatures today are likely to peak in the mid-70s with easterly winds of about 10 mph and higher gusts. There may be a lull in the rain this evening (or not) before more widespread showers return after midnight.
Friday
I expect Friday to be similar. If there is a time when we may see more dynamic weather, including heavier rain, it probably will come on Friday afternoon or during the early evening hours. I don’t have great confidence yet, but it’s possible that some sort of line of storms will push through the area from west to east during the evening commute, and disrupt the start to the weekend. We’ll keep an eye on that. Some rain chances will linger Friday night but generally, by Saturday morning, the upper-level system will have moved on.
Saturday and Sunday
The weekend should see partly sunny and warmer skies. Look for highs in the mid-80s on both days, and sultry springtime lows only dropping to around 70 degrees. With dewpoints in the upper 60s, it will definitely feel pretty humid after winter in Houston. It’s good for the skin, I guess.
Next week
Most of next week should see additional warm and humid weather with highs generally in the mid- to upper-80s and warm nights. We may briefly see some drier air on Monday night and Tuesday with a weak front, but it will not be much to write home about. Some kind of front may push through next weekend to bring cooler weather by Sunday or Monday, but since that’s 10 days out our overall confidence is fairly low.

I had forgotten that rains could even be gentle. Nice.
I remember hearing that the rain would generally be out of the area by about noon on Friday. Must have been a forecast for a different Houston, TX.
“Hate, it has caused a lot of problems in the world, but has not solved one yet.” – Maya Angelou
You should probably not spend too much time “hating droughts” and “hating heat” if you live in Houston, Texas. It’s not healthy. I have been here my entire life and it seems droughts, heat, floods, derechos, hurricanes and tornados as well as mosquitos are the norm about six months of the year. The other six months of the year we experience some pretty nice weather if you rule out the occasional freeze…
Derechos are not the norm here.
There’s no way I’m throwing positive love and light at a derecho.
Screw that.
Or at F3 tornados at Christmas. That scared the Joy right out of me, running to an inner room in shock with the F3 circling outside. Literally. Please to NEVER feel that again. 🎄🌪 👈🏻
Houston isn’t Camelot, where are those mythical six months? Even October and November are now suspect.
I would not throw “positive love and light” on any dangerous weather event. I only state that they are all possibilities living here in Southeast Texas and if you do not want to experience the trauma of these events living in this region may not be best for you. No Houston is not Camelot but the weather is pretty nice here (most of the time) from October through April.
Amen Glenn.
So my main comment is actually about yesterday‘s Q&A post because the comments are already closed less than 24hr later. I think comments for the monthly post should last a little longer than that.
For the first question about warm days coming earlier, the graph doesn’t actually show that. Perhaps it’s mislabeling the axes or miscommunication, but something ain’t right on that one. All the lines are trending up and to the right, which is actually getting earlier in the year, according to the axis on the left.
Take a real close look everybody & explain how I’m wrong.
You say “For the first question about warm days coming earlier, the graph doesn’t actually show that,” but then you directly contradict yourself by saying, “All the lines are trending up and to the right, which is actually getting earlier in the year.” You are directly acknowledging that you see the lines trending upward, which corresponds to those days coming earlier in the year.
The chart has two axes. The Y axis is the months of the year in descending order, and it wraps from Dec to Jan near the bottom to show winter. The descending order of months on the Y axis indicates +Y (that is, up) is earlier in the year, and -Y (that is, down) is later in the year.
The X axis is the year of measurement. Time tends to only move one way, so +X (that is, right) is the direction you read the data in.
The chart has two lines. The top line shows a five-year rolling average of the earliest 80F day. The line trends up, indicating the date of the first 80F year on average has moved earlier in the year. If you use your eyes, you can see that the line has risen from late Feb in 1980 to the last week in Jan in 2025. Line go up mean hot day come earlier.
The bottom line shows a five-year rolling average of the latest 80F day. In spite of not moving much from 2010 through 2023, the sharp uptick last year pushes the regression line into a similar upward trend that correlates with earlier rising. Again, line go up mean hot day come earlier.
Not sure what’s so hard about this, or what you think you’re missing, except that you apparently just can’t read a simple graph.
Thank you, my mistake. I flipped the axes in my head.
I appreciate the fulsome explanation, but next time leave the Snark to yourself, sir.
Well….when you close your original post with “Take a real close look everybody & explain how I’m wrong,” you come across as wanting to be vindicated in your view as opposed to really just wanting an explanation.
C’mon, you literally asked for it.
Are we all through acting like children?
The bottom line just looks wrong to me, given that it says the last 80 degree day of 2025 is in late October, which hasn’t happened yet.
Got some training rains going along from Katy to Cypress.. nice gentle rain!
Bububu, the tv guys are screaming terror!!
What is the prediction for weather along the Texas independence relay trail between Gonzales and Houston?
Very hot and humid
This upper level system will bring much-needed rain, but also some much-needed mosquitos!
I’ve missed those little buggers!
Said no one ever
The problem I had with the graph yesterday was the starting point. The 1970’s were one of the coldest decades in our recorded history. If you start at the coldest point of course the warming is going to look more dramatic. If you start at say 1900 the line would look much less dramatic…
Very true. They do the same with the Arctic Ice sheet. They began collecting data in 1979, which was the end of a cold period. There was actually much less ice in the Arctic in the 1940s than in the 70s. There seems to be ups and downs throughout history with temperatures. We are currently in a steady upward trend. I’m hoping we enter another down phase soon, though.
Will these rains have an impact on the worsening drought in the entire state of TX? The worst of it is in West Texas which isn’t receiving anything from this system unfortunately, but hill country is under a severe drought as well. Looks like they’re in the target area to receive at least some rain. I wonder if this has impacted this years Bluebonnets there as well. I’ve seen plenty around Houston lately.