Editor’s note: On July 29, 2025, we published a new version of the Space City Weather Flood Scale. The new version incorporates research done by two psychologists at the University of Houston, Steven Paul Woods, Psy.D. and Natalie C. Ridgely, Ph.D. We intend the new version to be more user friendly and helpful in the time of a storm. In this post, Drs. Woods and Ridgely explain the research they did to inform this update. And here’s a link to the official news release from the University of Houston.
How can we help Houstonians better prepare for major weather events?
An impassioned tweet from Matt about the challenges of weather communication during the 2022 hurricane season led us to wonder: Can we use psychological science to help Houstonians better understand and prepare for major weather events? We posed this question to Matt, who was enthusiastic about the potential of a meteorology-meets-psychology research collaboration. Matt and Eric were specifically curious if we could boost the usefulness of the beloved Space City Weather (SCW) Flood Scale (Lanza & Berger, 2023).
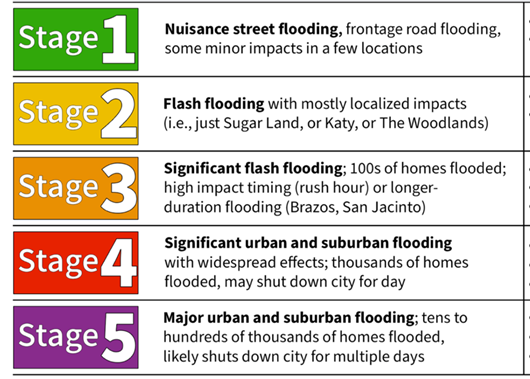
The original goal of the SCW Flood Scale was to help Houstonians better understand and prepare for a wide range of flooding events. The SCW Flood Scale uses a color-coded numerical rating system (1 green = nuisance street flooding to 5 red = severe life-threatening flooding) and provides a historical flooding event for context (e.g., Hurricane Harvey). But does it nudge people to actually prepare for flooding? This is important because even when people know the flooding risk of an approaching storm, they may not turn that knowledge into useful ways to protect themselves (i.e., weather-protective behaviors). There are meaningful gaps between what we know, what we intend to do, and what we actually do (e.g., Fishbein, 1979). Providing people with direct informational cues can help bridge these gaps (Grounds & Joslyn, 2018; Woods et al., 2022). So, we designed a simple experiment to see whether including examples of appropriate weather-protective behaviors at each level of the SCW Flood Scale helps people do a better job of planning for storms.
How did we do this study?
The Storm Forecasts: With Matt and Eric’s help, we created three realistic storm forecasts that varied in severity on the SCW Flood Scale (i.e., Stages 1, 3, and 4). We presented these storm forecasts to people in a randomized order.
The Weather-Protective Behaviors: After hearing the three storm forecasts, participants were asked to rate their intentions to do 12 different weather-protective behaviors on a scale of 1 (unlikely) to 5 (very likely). Higher scores mean stronger plans to practice useful weather-protective behaviors. We included actions that would be helpful in a flood, like reducing the amount of time spent on the roads, gathering necessary supplies, charging electronic devices, and listening for emergency alerts. We also included actions that sounded reasonable, but may not be helpful during a flooding event, like wrapping exposed pipes, securing the foundation of their home, or sheltering in a basement.
The Experimental Groups: The study participants were randomized into one of two groups: 1) A control group who saw the standard version of the SCW Flood Scale; or 2) A weather-protective cue group who saw a new version of SCW Flood Scale that included examples of weather-protective behaviors at each level of flood risk (e.g., Stage 1 = Consider reducing time on the roads; Stage 3 = fuel vehicles; Stage 5 = identify safe evacuation routes).
The Study Participants: We recruited 100 healthy adults from 5 Gulf Coast states to participate in this study. Importantly, the control group and the weather-protective cue group did not differ in demographic factors (e.g., age, education), cognitive ability, weather literacy, and experience with storms.
Did the experiment work?
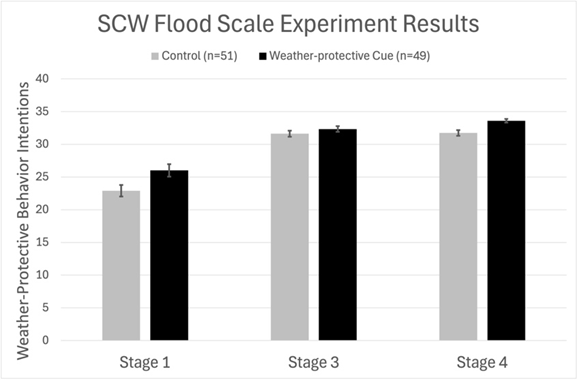
In brief, yes! People in the weather-protective cue group did a better job of planning for the storms. Figure 1 shows the flood-protective behaviors on the vertical axis, where higher scores mean better plans to practice useful flood-protective behaviors. The individual storm forecasts are on the horizontal axis. You can see that the benefits of the protective cues varied by storm severity. The flood-protective cues had strong benefits for the most (Stage 4) and least (Stage 1) severe storms, but only weak benefits for the Stage 3 storm, which was a fast-moving wind event for which flood protective recommendations may be somewhat less clear. Encouragingly, we also found the largest benefits of the flood-protective cues among people who had the lowest levels of baseline weather preparedness. That means we were able to improve flood-protective plans for the people who were at greatest risk of being unprepared. Finally, we found that the flood-protective cues had no effects on non-beneficial actions (e.g., wrapping household pipes). In other words, the flood-protective cues only nudged people towards doing things that are known to be helpful for their health and property during a flooding event.
What’s next?
The results of this simple experiment suggest that adding flood-protective action cues to the SCW Flood Scale increases the likelihood that people will plan to safeguard their home and health in response to flood forecasts. We are excited that Matt and Eric will be working with Reliant to add the flood-protective cues to the SCW Flood Scale moving forward. And we hope that this new version of the SCW Flood Scale will provide additional support and comfort to Houstonians as they prepare for future storms. We are currently looking at whether the benefits of the flood-protective cues vary across people who may be particularly vulnerable to weather impacts, including older people and those with serious medical conditions. We are also curious to learn more about what leads people to choose non-beneficial weather-protective actions in these situations. Finally, we would like to know whether we can help Houstonians better understand and use heat warnings. So, stay tuned for more meteorology-meets-psychological science!
Steven Paul Woods, Psy.D. and Natalie C. Ridgely, Ph.D.
Department of Psychology, University of Houston
References
Fishbein, M. (1979). A theory of reasoned action: some applications and implications. Nebraska Symposium on Motivation, 27, 65–116.
Grounds, M. A., & Joslyn, S. L. (2018). Communicating weather forecast uncertainty: Do individual differences matter? Journal of Experimental Psychology: Applied, 24, 18–33. https://doi.org/10.1037/xap0000165
Lanza, M.R. & Berger, E. (2023). The Space City Weather Flood Scale: An imperfect attempt to help a flood-weary region put rain forecasts in context [abstract]. Paper presented at the 103rd Annual AMS Meeting, Denver, Colorado, USA.
Woods, S. P., Morgan, E. E., Loft, S., Matchanova, A., Verduzco, M., & Cushman, C. (2021). Enhancing cue salience improves aspects of naturalistic time-based prospective memory in older adults with HIV disease. Neuropsychology, 35, 111–122. https://doi.org/10.1037/neu0000644