In brief: The National Hurricane Center released their post-storm report on Hurricane Beryl late last week, bumping its landfall intensity in Texas from 80 mph to 90 mph. The report also features a number of nuggets of information, statistics, and images. This post summarizes some of the highlights.
Hard to believe it’s been over 6 months now since Hurricane Beryl thrashed the Houston area. As is customary, the National Hurricane Center released their post-storm analysis on Beryl late last week, and there were some notable changes to the storm’s history. It is important to be clear that this is a common thing. When the storm is hitting, forecasters are consuming so much data and issuing constant updates that they don’t always have a chance to lock down all the finer details of the storm. In the postseason, there is the the luxury of being able to scrutinize all available data to make an objective determination of a storm’s data points. National Hurricane Center forecasters do this with every storm.
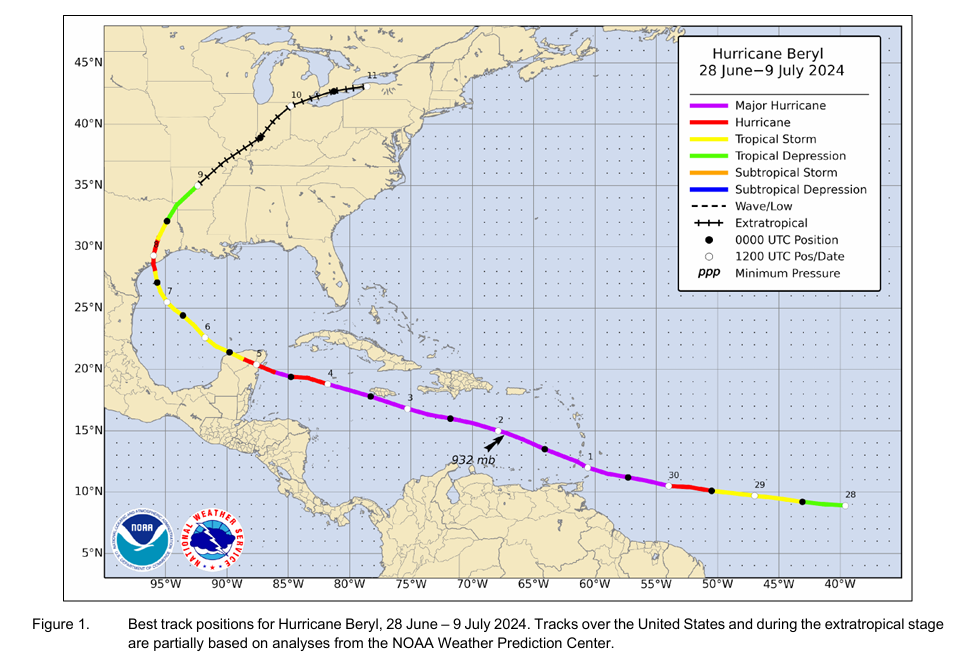
Beryl was a strong category 1 storm
While Hurricane Beryl was presumed to have a landfall intensity of 80 mph when it came ashore in Texas, the postseason review determined that this was too low. Beryl got an upgrade to a strong category 1 storm, with 90 mph maximum sustained winds at landfall. This is interesting, and it makes the comparisons to Ike somewhat more relevant in a data sense.
Ike came ashore as a weakening category 2 storm with 110 mph maximum sustained winds. Beryl came ashore as a strengthening category 1 storm, having rapidly intensified from a 60 mph tropical storm to a 90 mph hurricane in about 14 hours. While that’s still 20 mph of difference in maximum sustained wind, the fact that the two storms were trending in opposite directions, and all else the same, the weaker side of Ike wasn’t that much stronger than the “dirty” side of Beryl, which Houston experienced. This makes the similarities between the storms in terms of widespread tree damage and power outages more comprehensible in retrospect.
Also worth noting, Beryl peaked in the Caribbean as a category 5 storm with ~165 mph maximum sustained winds, confirming the intensity reported in the advisories. The report stated that “the maximum intensity of Beryl is somewhat uncertain due to temporal gaps in the aircraft data near the time of peak intensity, and issues with (microwave) surface wind estimates that prevented their use in this evaluation.” In other words, some of the data was unusable, and the timing of the reconnaissance flight into Beryl may have differed from the exact time of peak intensity. Whatever the case, 165 mph is dang strong.
Beryl didn’t weaken immediately at landfall
One reason Beryl came in stronger than the typical category 1 storm is that the storm likely continued to strengthen just beyond landfall. Where the storm came ashore is not exactly terra firma. Given the geography around Matagorda Bay, the technical landfall may have occurred before the storm truly got on land. The NHC determined this by noting that the minimum pressures recorded near the Texas coast occurred after landfall, indicating that the storm had passed but pressures were still lowering instead of rising as is typically the case. Basically, much like a large ship trying to make a 180° turn, Beryl needed a moment before it could tap the brakes.
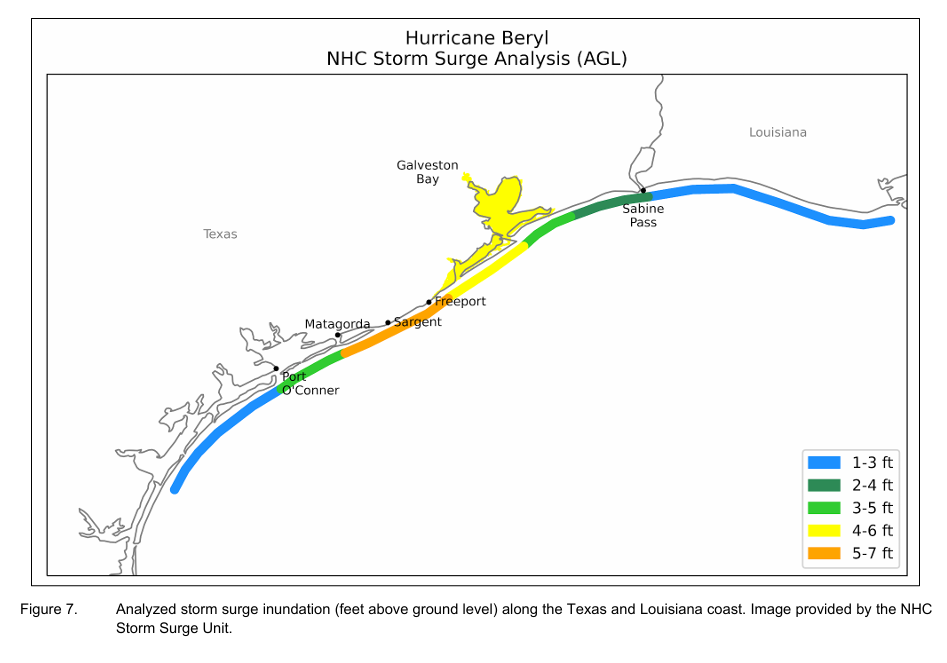
No surprises with rain or storm surge
Generally speaking, Beryl produced a surge height of 5 to 7 feet above ground level between Matagorda and Freeport. Much of this is based on high water mark assessments by teams following the storm. Surge values decreased to about 4 to 6 feet above ground level between Freeport and Galveston. Maximum rainfall was around 15 inches in Thompsons in Fort Bend County. That was an exception, as most locations generally saw 8 to 12 inches of rain.
The forecast was excellent—except here
The NHC track forecast beat their average errors at almost all lead times on average through Beryl. A notable exception? When Beryl was in the western Caribbean and the majority of model guidance favored a Mexico landfall. From the report: “The largest track forecast errors occurred during the time that Beryl was moving through the western Caribbean when the forecasts for landfall on the western Gulf coast had a strong left or southward bias. Indeed, the Texas landfall position in the best track is at the right/northward edge of the official forecasts, and the forecast landfall points shifted significantly to the north as the storm approached the coast.” They go on to state that the TABM model (which basically just assumes a medium intensity storm) did best, whereas the ECMWF (Euro) and GFS (American) models failed. The reasons for the failure are not clear at this time.
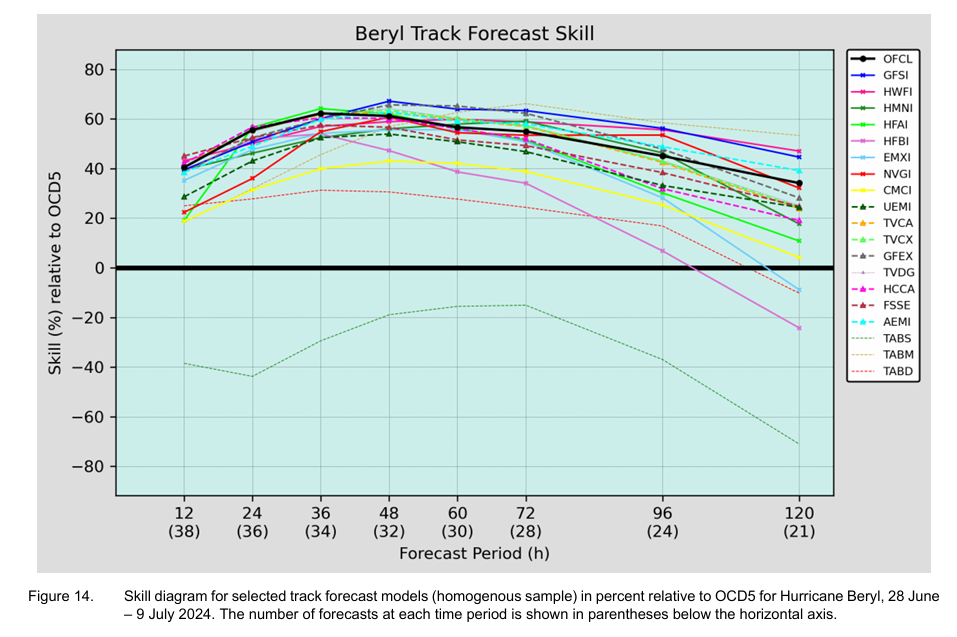
A glaring caveat to all this? They do not include the ICON or European AI model in track errors, which in my subjective view did best capturing the risks to Houston. One major change we implemented at Space City Weather was to give those models much more weight after Beryl, and they continued to perform well last season. Google’s AI GraphCast also did a very good job identifying the northward risks early on.
Beryl remains a warning to Houston
We’ve said this countless times in the wake of Beryl and since: It was a warning to this region. Beryl had 14 hours of favorable conditions over water to strengthen and went from a tropical storm to nearly a category 2 hurricane. What if it had 24 hours, and started from a 70 mph tropical storm? 36 hours? We’ve seen this play out in Florida, Louisiana, and the Coastal Bend several times since 2017 with storms in the Gulf of Mexico. Harvey, Michael, Ida, Ian, Idalia, Helene, Milton to name some others. It really is a matter of when, not if. We need to continue to focus on ensuring we’re prepared every year with our hurricane kits, getting more people to adopt that practice, and continuing to invest in resiliency and infrastructure improvements, which is to say: Build the damn Ike Dike.