We’re back with a new Q&A! Eric and Matt have had their hands full with their day jobs the past couple of months, and that is likely to continue, so consider these kinds of posts “occasional” rather than monthly going forward.
Got a question of your own for our next round? Leave it in the comments, or drop it into the Contact link on the home page. We may also troll our Facebook page for Qs that we can A.
– Dwight
Q. What does the temperature being so hot this early do to the hurricane season this summer?
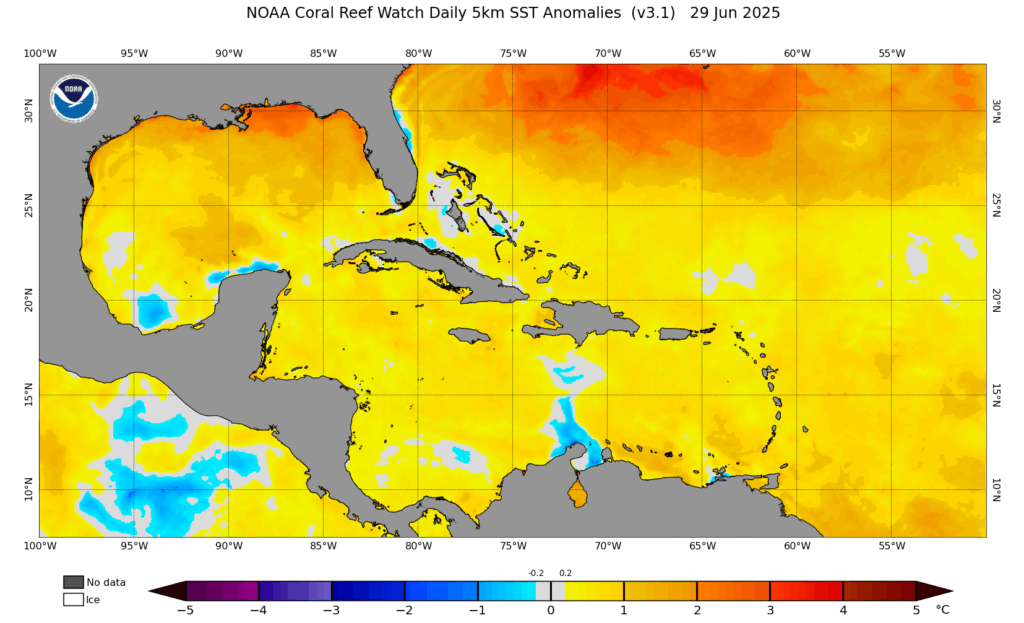
A. The average temperature in May was 3.2 degrees above normal in Houston, and nearly 2 degrees above normal in June. Part of the reason for this is that sea surface temperatures in the Gulf of Mexico are warmer than normal. (This influences local air temperatures, especially at night).
A warmer Gulf, of course, means that any passing hurricane or tropical storm will have more energy available to support intensification over water. So in that sense, warmer temperatures are more favorable for stronger hurricanes. However, aside from that connection, there is nothing I am aware of that links air temperatures in Texas in early summer to making the region more prone to hurricanes in a given season.
– Eric
Q. I’ve seen your posts about local forecast issues because of weather service cuts, but I haven’t seen much about how it might affect hurricane forecasting in general. Can you address this?
A. Like just about everything, the real answer to this question is somewhat nuanced. Simply put, we rely on a lot of data from NOAA and the National Weather Service to inform our forecasting. So any cuts to their services or data would be problematic. Despite all the noise around budget cuts and such, thus far, there have only really been 2 significant items of note that could negatively impact actual hurricane forecasts right now.
First is the loss of routine weather balloon launches collecting upper air data across parts of the middle of the country. We covered the impacts of this at The Eyewall in detail back in March. In short: If those weather balloon launches remain on hiatus with active storms in the Gulf, that could negatively impact the forecast of the tropical storm or hurricane track enough so that we would want to “pad” our forecasts by a few extra miles on either side of the cone.
Secondly, news that came down late last week is more important and troublesome. We also covered that at The Eyewall. In a nutshell, a Department of Defense satellite is nearing the end of its life. Last week, they announced data would cease on Monday from a particular instrument on that satellite that is critical to hurricane forecasting. Early Monday it was reported that the satellite instrument had been granted a reprieve until the end of July. This Special Sensor Microwave Imager Sounder (SSMIS) helps meteorologists see through the clouds in tropical systems, allowing them to make much better intensity estimates. The loss of that data will lead to somewhat poorer initialization data on storm intensity and location, which could impact every model we use to forecast. While there are some fallback measures in place, it goes without saying that that is a huge loss. Unfortunately, aside from questionable communication of the decision from the government, this seems like just a poorly timed coincidence more than anything.
Neither kneecaps us this hurricane season in terms of forecasting, but it will make us think twice about being highly confident in any given scenario, even within a day or two of landfall.
Related to this, is that the administration’s proposed budget for NOAA was formally given to Congress on Monday, and it basically destroys the entire infrastructure of weather research in America. That’s a much bigger threat than anything done so far, and it would without question set weather forecasting and research in this country back years.
– Matt
Q. Last year I moved into a house with a yard for the first time in my adult life. I lived in a townhouse for almost a decade and one of the things that attracted me to it was not having to take care of a lawn. Unfortunately I’ve gotten to where I was really struggling to live in a two story. I have someone who cuts the grass and amazingly have been able to get away with not watering yet, but I know it’s coming. So any hints? How do I know when it needs it? How long to run the sprinkler? What time of day is best?
A. Well, you’ve picked a good year to have a lawn. March and April were fairly dry months for most of the region, but we had not yet reached the real growing season for lawns yet. By the time warmer temperatures started to arrive in May, we began to see regular rains. The pattern continued into June when we have seen plenty of rain. So far, so good, in terms of not needing a sprinkler this year. But July and August are looming, and I doubt we’ll get through the next two months without needing to water lawns.
As a general rule, I find that if a yard in full sun receives a soaking rainfall, it can go about 7=10 days before needing to be watered. Areas in partial shade can go several days longer. There is no secret about when grass needs to be watered. First it will start to wilt, then the grass will appear to be thinner and weaker as it dries out. The ground will be hard. This is the last step before grass begins to brown and dry out. You need to water the grass before it turns brown, because then it will be too late.
In terms of amount, I find that 20 minutes every three days works pretty well. Early morning is best. Please note I am far from a lawn expert, but I do have a quarter of a century of experience keeping a lawn alive in Houston.
– Eric
Q. Is it true that flat land is more prone to tornados? I know the area around St. Louis has some flat land. And we do get some tornados here. Does Houston’s urban landscape, with lots of tall buildings, protect us at all?
A. There are a number of persistent myths about tornadoes that have withstood the test of time for one reason or another. First, tornadoes seem to be more common over flat land because a number of tornadoes that are visually documented in the most dramatic fashion tend to occur in the Plains, which are generally flat.
I mean, it’s tough to beat an image like that. But reality is nuanced! Tornadoes have occurred in all 50 states, and what determines where tornadoes most likely occur is less about terrain and more about large scale weather and climate patterns, which is why the Plains and Southeast tend to lead the country in tornado events. But at a local scale, some areas can be somewhat more favorable than others due to topography. For example, we’ve seen a few examples of tornadoes impacting near Pikes Peak in Colorado in recent years, including just last month!
Tornadoes have occurred even higher in elevation in Colorado including a 2012 Mount Evans tornado at nearly 12,000 feet.
Two places near where I’ve lived have some topographical features that can produce enhancement of tornado risk: Parts of southeastern Pennsylvania have mountains to the west and Delaware Bay to the southeast, which almost acts like a much smaller scale version of the Rockies and Gulf respectively in feeding a miniature tornado alley. In Upstate New York, added “twist” to the wind north of Albany because of the intersection of the Mohawk and Hudson Valleys can add a little extra “oomph” to tornadoes there too, an area that is more hilly than flat.
Houston’s urban landscape does not really protect us. While it may act to locally enhance or “shadow” certain thunderstorm impacts, the downtown skyscrapers are not immune to tornadoes. A tornado went through downtown in 1970. Granted it was fairly weak. But Houston’s tornado history is littered with generally lower-end tornadoes in all corners of the city. Other major downtowns that have been hit by tornadoes include Nashville, Fort Worth, Miami, Los Angeles (yes, for real), Salt Lake City, Atlanta, and more.
So downtown skyscrapers offer no real protection. The reasons downtown areas get hit so infrequently overall is simply a matter of luck and math. The footprint of rural land is much greater than that of urban land. So the odds of an urban center being struck by a tornado are automatically much lower than an open field or farmland in the Plains. And it’s why tornadoes that hit cities tend to get covered significantly in the media, simply because more people and structures are impacted.
Bottom line: Tornadoes can occur virtually anywhere and cityscapes and elevation in most cases don’t offer protection. The causes of tornadoes are because of atmospheric ingredients and geography, sometimes buoyed by local effects of topography.
– Matt