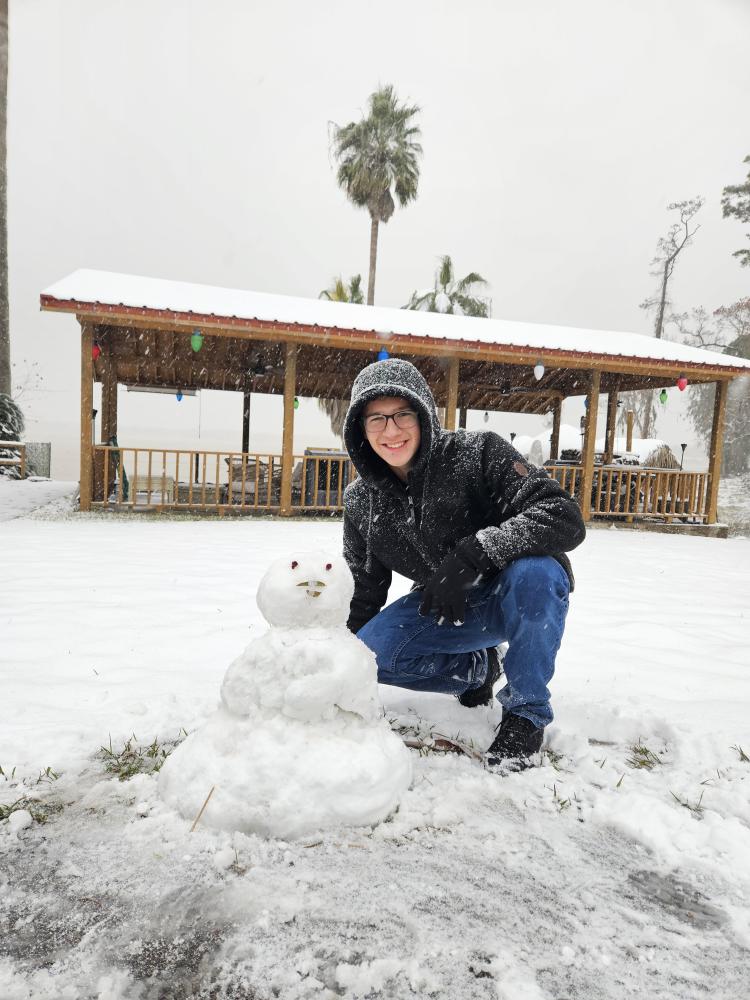
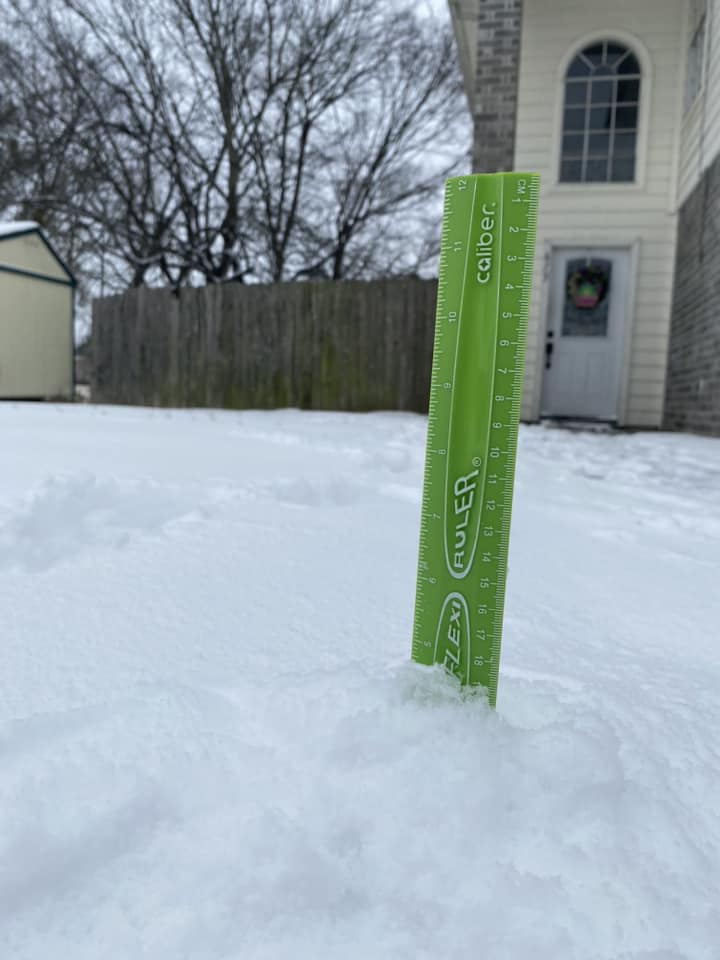
By the skin of our teeth, we’ve got the January SCW Q&A out the door. Many of the questions we got this month were – no surprise – inspired by our recent snowstorm.
Got a question of your own? Hit the Contact link in the blog’s header, or leave it in the comments below.
Q. The city asks people not to let faucets drip because it lowers water pressure. I understand there are ways to keep pipes warm, but how much does a dripping faucet actually help prevent pipes from bursting anyway? I’d rather have lower water pressure than broken pipes but wonder if letting faucets drip even helps much.
A. We get asked this question so often, and our standard response is: We are not plumbers. We are just not experts in this area. So we can offer some general thoughts, but you should really consult a plumber, and your water utility.
My best advice, as a homeowner in Houston, is to know where the main water shut-off switch is to your house, and if you’re concerned about freezing pipes, shut off the water supply and drain your pipes (i.e. run faucets until nothing comes out) before going to bed on nights when the temperature is expected to be below 25 degrees.
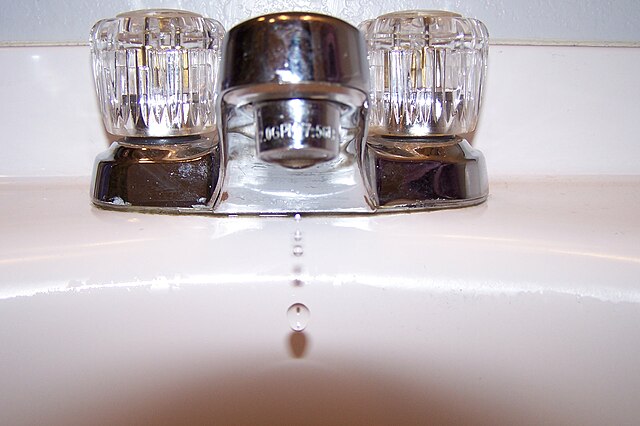
As for dripping faucets, cities do not like that because it is not great for pump-based water systems. If too many people do it, it can reduce overall water pressure. If that gets too low, contaminants can get into the water supply, which can then result in a boil-water notice – and nobody wants that.
In unincorporated Harris County and those areas served by Municipal Utility Districts, it’s OK to drip pipes because water pressure there is generated by gravity – water towers and tanks – not pumps. During a freeze, your water utility will let you know what’s best.
So while homeowners may find comfort in dripping faucets, and many plumbers recommend it, be aware of what your utility is saying.
As my wife will attest, I am just about the least handy person on the face of the Earth when it comes to home maintenance.
– Eric
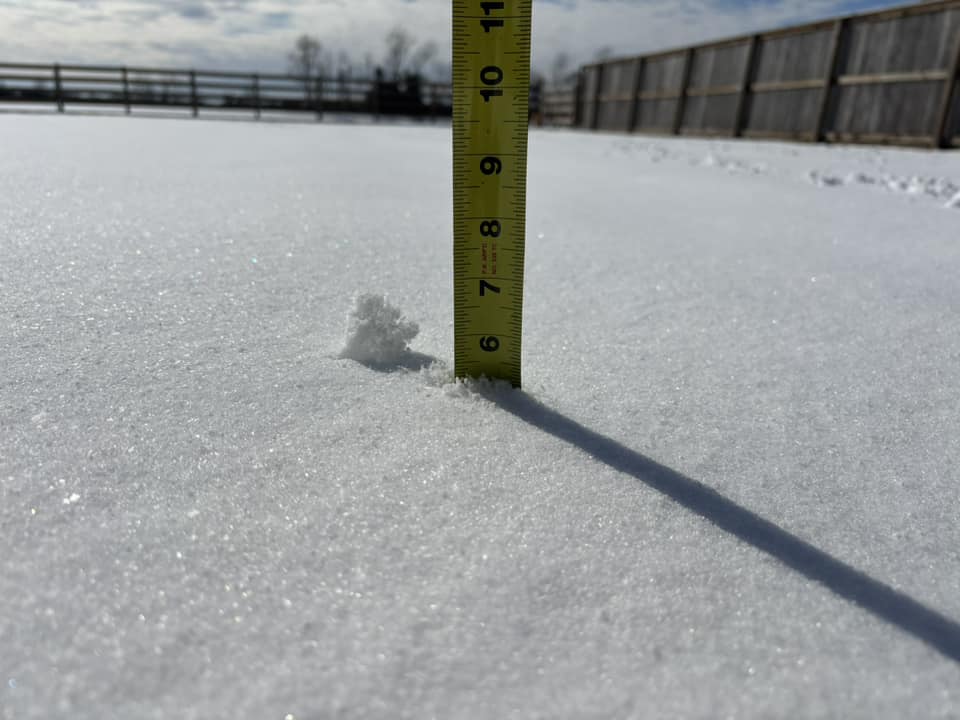
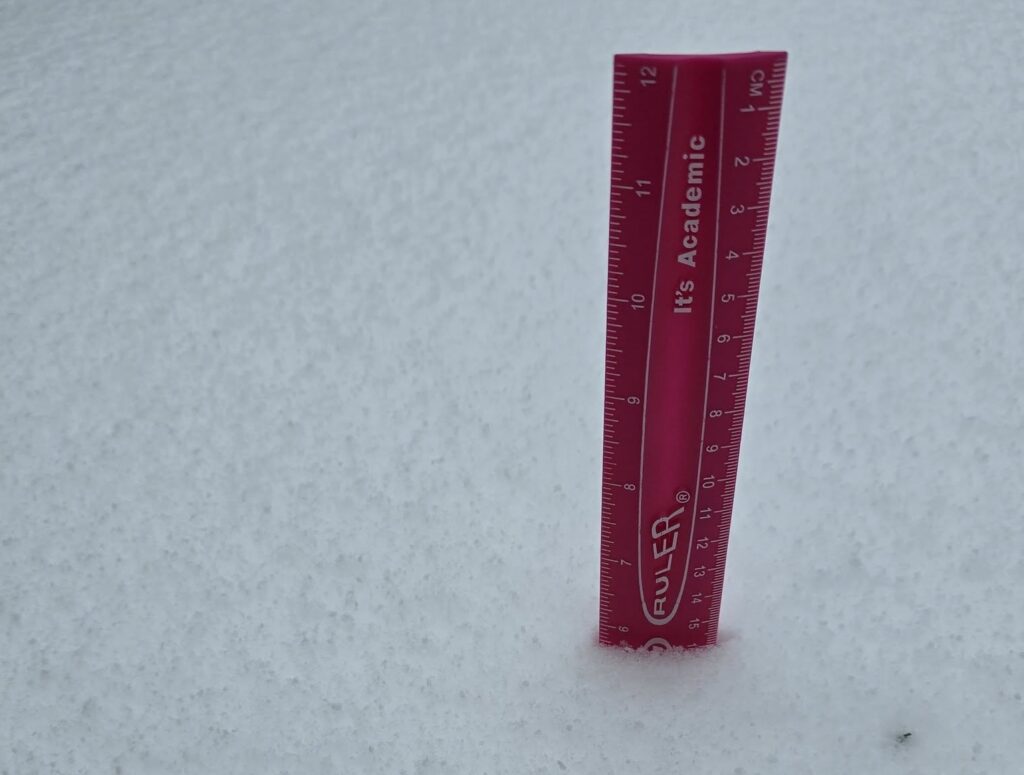
Q. Was it (January’s snow) really a “storm”? Traditionally, a storm is a violent event, typically bringing high winds, heavy precipitation, lightning, thunder, and other various tumults. While this event was unusual by Texas standards, it would barely have attracted notice in more northern locales. So my philosophically pedantic question is, does just being ‘unusual’ justify the use of the ‘storm’ moniker?
A. Ah yes, this is the kind of question we battle a lot in meteorology. Is it hot or warm? Cold or cool? A storm or just rain? And it gets to the heart of a more important question my colleague and friend Nick Lilja has asked, which is “What is severe weather, really?” Everyone has their own perceptions and definitions and to one-size-fits-all it is difficult.
But to the original question: The American Meteorological Society defines “storm” as a “disturbed state of Earth’s atmosphere, which can manifest itself in temperature, humidity, pressure, wind velocity, cloud cover, lightning, and precipitation.” Which seems to imply it’s OK to call our recent snow a “storm.” That is a really, really broad definition though. The AMS goes on to further define things. “Storms are organized disturbances that range in size from meters to a few kilometers (microscale, e.g., tornadoes), to a few to several hundred kilometers (mesoscale, e.g., mesoscale convective systems), to many hundreds of kilometers (synoptic, e.g., tropical and extratropical cyclones).” That still tracks with last week. So far so good.
The definition further goes on to read “Inclement and potentially destructive weather is often implied with a storm; threats can include heavy precipitation, flash flooding/river flooding, and high winds. From a local and special-interest viewpoint, a storm is a transient occurrence identified by its most destructive or spectacular aspect(s). In this manner we speak of rainstorms, windstorms, hailstorms, snowstorms, etc. Notable special cases are blizzards, ice storms, sandstorms, and dust storms.”
So from a meteorological and scientific point of view, last week’s snow was definitely a “storm.” Or more specifically a “winter storm.” But your mileage may vary. You may think a thunderstorm with frequent, intense lightning is very severe. By definition, lightning has nothing to do with a “severe thunderstorm,” which is strictly defined as a storm that produces one of one inch or larger hail, wind of 58 mph or stronger, or a tornado. Like any other definition in meteorology, there is a little vagueness to it from a human standpoint, and you’re not always wrong for thinking something is or isn’t a particular defined phenomenon.
– Matt
Q. When you say south of I-10, do you mean Galveston? Or does that mean anywhere directly below I-10 (Montrose, Downtown, Medical Center, etc).
A. Great question, and it’s one we get often. One of the challenges of forecasting in the Houston area is that it is big! We are covering, basically, an area from Sealy in the west to Beaumont in the east, from Conroe in the north down to Galveston by the Gulf. Interstate 10 is a key dividing line we often refer to because a) most people know where it is, and b) it very roughly separates “coastal” from “inland” areas.

However, with that said, there are distinct differences between, say, Hobby Airport and Galveston Island. So yes, “south of Interstate 10” does include Galveston, but it also includes half of this huge metro area. When we want to call out the coast specifically we’ll say “coastal counties” i.e. Brazoria, Galveston, and Chambers counties. When we seek to highlight only areas very near the Gulf, which includes Galveston Island, we’ll sometimes say “immediate coast.”
By the same token, when we write something like “far inland areas” we mean areas along and north of Highway 105. And when we write “a place that sucks” we’re referring to Dallas.
– Eric
Q. Could you explain why there are so many variations among weather apps? For example, the AccuWeather app shows (last) Tuesday being having a high of 38 while almost all the TV weather is showing Tuesday not going above freezing. If all meteorologists pull from the same info why such a wide difference in the forecasts?
A. There are a couple reasons for this. I’ve been doing this 20 years, and one thing I’ve said is tried and true: Put 20 meteorologists in the same room with the same data, and you will get 20 different forecasts. And I don’t mean widely varying forecasts; just a lot of differences in specifics.
But there are a couple areas where broadcasters, apps, and even the data we see on websites differs. Let’s say the high temperature occurs at midnight because a cold front is pushing through, but the daytime temperature is going to be 10 degrees colder. What’s the high temperature that day? What matters to you planning your day? Broadcasters, sites like ours, and the NWS website will all illustrate this either explaining it or by using arrows to indicate that something is changing that day. Your app almost certainly will not.

But more important than that, every app uses its own special sauce. In other words, they are all deriving their forecasts from raw model data provided by NOAA, the European Centre (ECMWF), etc. They then work it through some proprietary algorithm that they’ve developed that essentially “bias corrects” the model data. They could be using the last week of verification, the last month, etc. Every app is different in that regard. I saw a presentation recently at the American Meteorological Society’s annual meeting in New Orleans from someone at AccuWeather that discussed this topic. One difference in their forecast is that their forecasters can actually go in and override data for a location or area if they have a strong conviction to disagree. Most apps do not come with that. I would assume The Weather Channel app does something similar.
So ultimately, each forecaster has their own opinion. For the apps, most of the “opinion” is bias correction of data, whereas for TV broadcasts or our comments, the opinion is based on our assessing the data and our past experiences. There will always be differences, but one reason I like our app is that it’s pulling forecasts straight from the National Weather Service. Their forecasts are usually solid and steady, and they’re derived locally. But as a consumer, I would always encourage you to shop around to get a sense of what everyone is thinking.
– Matt
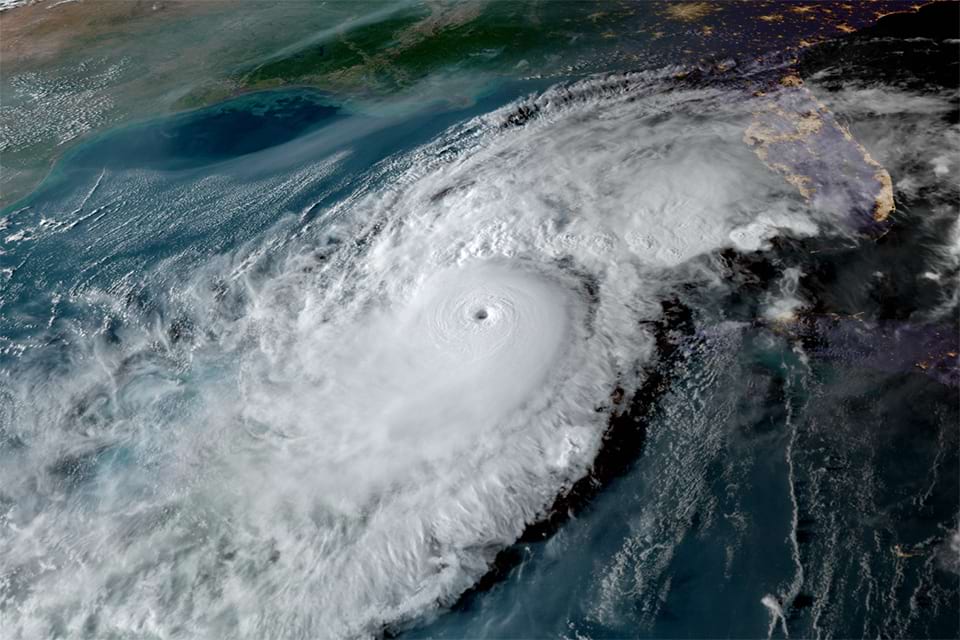
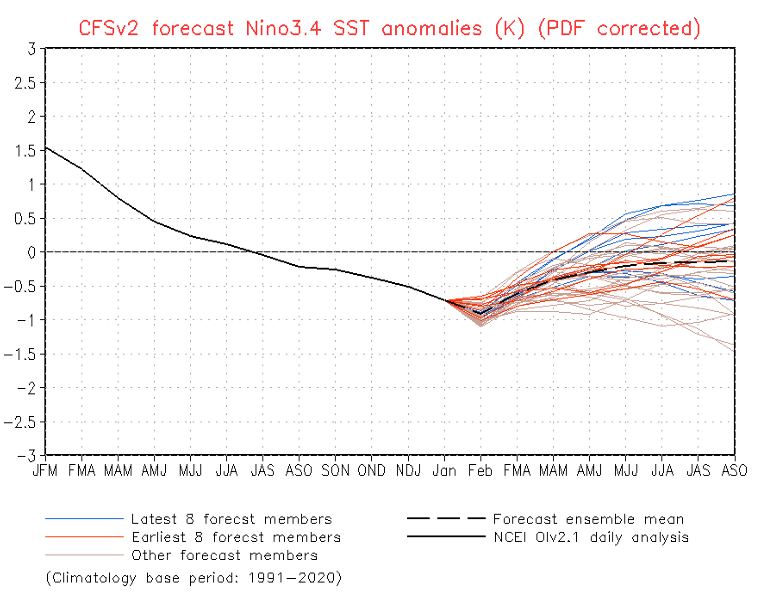
Q. I have a question- where did La Niña (warm and dry) go? Where do you think we’ll be Spring and Summer of 2025 – La Niña, El Niño or neutral?
A. According to NOAA’s most recent outlook, from late January, La Niña conditions are still present in the equatorial Pacific Ocean. Most modeling indicates that La Niña will persist through the spring before transitioning to neutral conditions. As for what happens after that, well, it’s kind of a crapshoot. Most of the guidance indicates neutral conditions lasting into the summer (and the Atlantic hurricane season). However, as we like to say here on Space City Weather, we’ll see.
I think you may be asking why have we not had a warmer and drier winter, which is typical during La Niña? To which I would say let’s see where the average temperature and rainfall end up at the end of February. I think it’s quite possible we end this winter with warmer than normal temperatures and near normal precipitation, which would be consistent with what one expects from La Niña. We’ll be sure to report back on that at the end of winter about a month from now.
– Eric