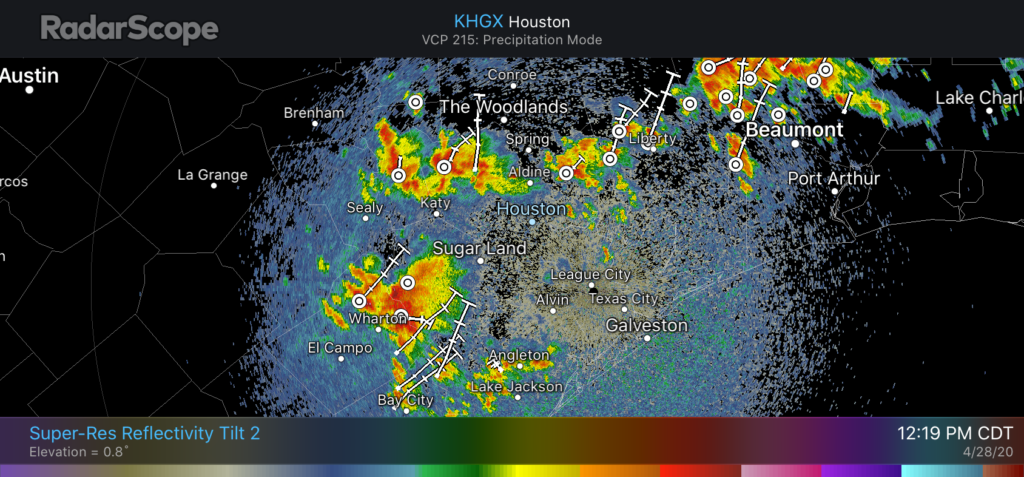
For the second time in four days Mother Nature has delivered a surprise. In today’s case, a capping inversion that was expected to hold sway over the Houston region during the daytime Tuesday is breaking. Thus, a cluster of strong thunderstorms is now moving into the region from the southwest along with an upper-level disturbance.

With the cap breaking and plenty of moisture, it seems likely that this threat of heavy rainfall and thunderstorms may be with much of the metro area throughout the daylight hours today. Because of the high rainfall rates in some of these storms, we may see localized flooding throughout the afternoon hours. Storms should ebb this evening.
It still appears as though a bow-line feature will move through Houston after midnight, and push through the region from north to south, with the worst of it offshore by around sunrise or shortly thereafter. We still expect this system to deliver the kinds of severe weather we discussed in this morning’s weather post.

Might the recent difficulties with our local forecasting models be attributable at least in part to the models’ not yet being fully caught up on the economic consequences of the lockdown to particulate levels in the local atmosphere (and to industrial heat islands, &c, &c)?
I was wondering this same thing. Glad you asked the question.
I had the exact same question
I don’t think there’s been a significant decrease in industrial emissions, only traffic. Most of the chemical industry (who are making most of these emissions) is considered critical, and has been continuing to operate. Is there even evidence that industrial emissions are capable of affecting local weather patterns?
We’re still running on the Channel, but our logistics people are going nuts trying to find places to put product while simultaneously hoping a feedstock provider doesn’t have to shut down like they said they might. Or if we have to back off on production, that two barges of feed don’t show up out of nowhere.
You can’t win.
Also, trees are still living and they are one of the biggest (if not the biggest) source of VOC emissions in Harris County.
I’ve no idea. Like most of my fellows, I went to law school expressly so that I need never do math and science ever again, and can treat life as an essay question.
And because I am a complete Elephant’s Child.
That’s why I asked.
It’s got more to do with decreased air traffic. Planes provide the weather service with valuable upper air measurements. Fewer planes = fewer data points to feed the models.
Thank you. Avoiding the the temptation to make a quip about starving models, I observe that this is the clearest and most straightforward answer ever given by an expert witness.
Ohhh…. just heard thunder…twice.
When I monitor the radar, I often whine that the rain seems to make an effort to avoid League City. This afternoon as I’m watching the storms come in on WeatherUnderground’s radar loop, sure enough, there seems to be a bubble around League City. But it’s suspiciously circular.
Now I’m wondering if there might be some kind of mask in the image processing to help get rid of ground clutter so close to the radar tower. Anyone know?
You are correct. The “bubble” is where the radar is located. You can clear some of it up by using the “remove clutter” feature. Most radar site have this function. However, there is no data right at the radar site. You can probably switch to the Lake Charles radar to see whats happening at the League City radar site.
There are times when the bubble is not there. I assumed they process the data somehow or combine other radar stations’ data to produce a good picture for the apps. But then other times it’s like they’re not doing that.
In this case the bubble seemed real. Our house literally got only drops of rain while it seemed like all around us got a lot more.
A couple days ago several high res models showed a 3.5″ bullseye for today almost exactly where they are getting the heavy rain in FB County. Why are we surprised?