Now that we’re in the middle of October, and summer is pretty much over, we’re publishing a review of what the region has experienced since the beginning of June. In short, it was the city’s hottest summer on record, and one of the driest. The end of such a brutal summer is one of the reasons why we’re excited to celebrate Fall Day this year—we’re all grateful for the onset of fairer weather. Please join us from 4 to 6 pm on Sunday at McGovern Centennial Gardens. If you’d care to let us know you’re coming, you can do so here.
I am going to break down this Summer 2023 review into an introduction about the data, and three sections. First up is a big picture look at what the region experienced this summer, in terms of temperature and rainfall. Second is a more granular look at the Houston area, and some of the specific trends that concern me the most. And finally, we’ll talk a little bit about what made this summer so hot, and what is causing these trends to occur.
About the data
To be clear, when we say hottest this is measuring “average” temperature, in the sense that you take a daily high, a daily low, and the average of that is that day’s mean temperature. When you do that over the course of a month, this June was the seventh hottest on record for Houston with an average temperature of 85.1 degrees, July was the second hottest, and August and September were both the hottest on record. September’s average of 85.3 degrees absolutely smashed the previous record of 83.9 degrees, set in 2019.
Secondly, let’s be clear about what “on record” means. Houston has recorded weather data since 1881, although records are only available since 1889 due to the loss of earlier data. The “official” weather station has moved around some as the weather office moved in downtown before finally reaching its present location at Bush Intercontinental Airport in 1969. Here is the complete lineage of official weather data in Houston.
- Cotton Station (July 1881 – September 1909)
- Stewart Building at Preston and Fannin (September 1909 – February 1926)
- Shell Building at Texas and Fannin (March 1926 – August 1938)
- Federal Building at Franklin and Fannin (August 1938 – May 1969)
- Intercontinental Airport (June 1969 – Present)
Given that the station has moved some, there is a bit of danger in comparing records from before 1969 to the present. But there are some work-arounds for this. Most notably, the National Weather Service has collected data at Houston’s Hobby Airport since 1930 (with the exception of the years during World War II). We’ll see later in the post how this is useful to looking at trends over the course of nearly a century. Ok, enough of a preamble, let’s look at the data for this summer.
Big picture overview
Thanks to persistent high pressure over the United States, this was the warmest summer on record for much of the Southern United States, including large swathes of Arizona, Texas, Louisiana, and Florida. Here is a map showing the ranking of the average temperature this summer during the three-month period of July through September
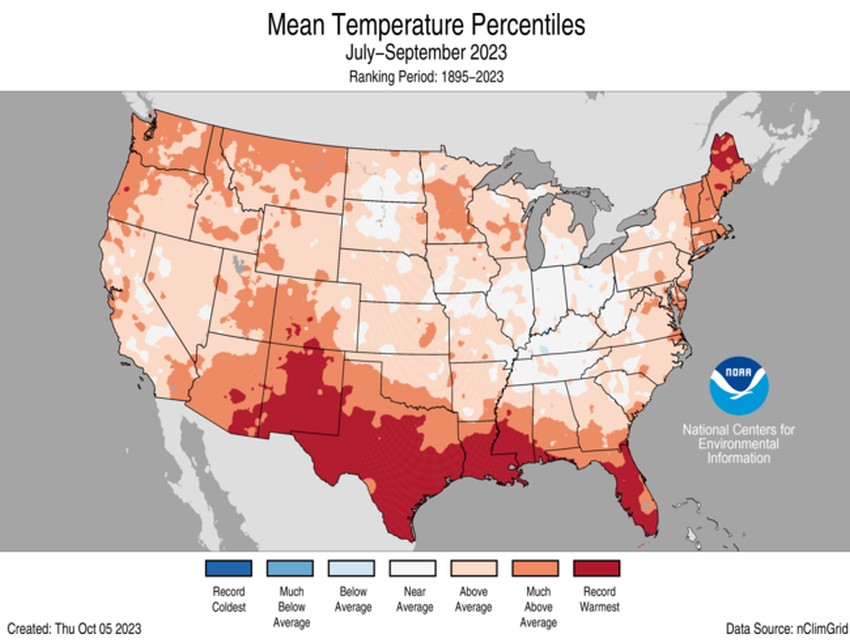
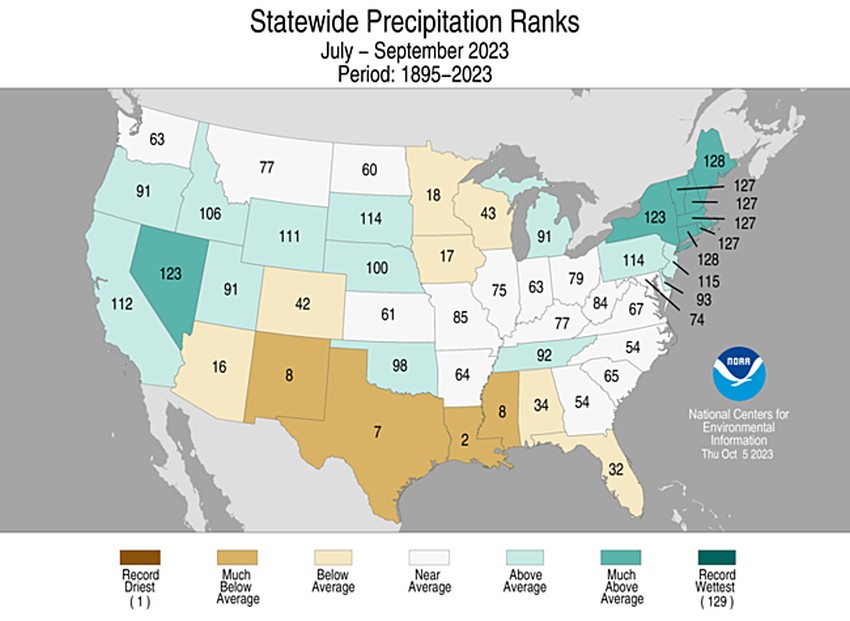
Note this data from NOAA’s National Centers for Environmental Information, and includes records dating back to 1895. A similar, though not quite as devastating trend occurred with precipitation. For Texas, this was the seventh driest on record, and for the Houston area it was among the five driest summers on record. What saved us from a truly terrible drought was a fairly wet spring.
Now let’s take a look at trend data for the Houston area. First up is the average temperature for the summer months of June through September, at Houston’s official monitoring location. An upward trend is clearly discernible, as the average summer temperature in the 1890s was 81 degrees, and it is now above 83 degrees. Also of note, this summer’s mean temperature of 87.3 degrees eclipsed the previous record set in 2011, 86.7 degrees.

One other thing I’d like you to note. See that dip in temperature starting in 1969? That corresponds to the move of the official weather station to Bush Intercontinental Airport. This is further inland from the Gulf of Mexico than downtown, and therefore nighttime temperatures are generally a bit cooler at night. You can click on the image to make it larger if you like.
I also want to share a graphic that shows a time series of 100-degree days in Houston. Note that there were 45 days this year with a maximum temperature of 100 degrees, which is one below the record of 46 days set in 2011.

Once again we have to consider the bias of Bush Intercontinental Airport. Because it is further inland, it tends to have warmer daytime temperatures than areas closer to the coast. So let’s zoom in to just the period of record from 1969 to the present day.
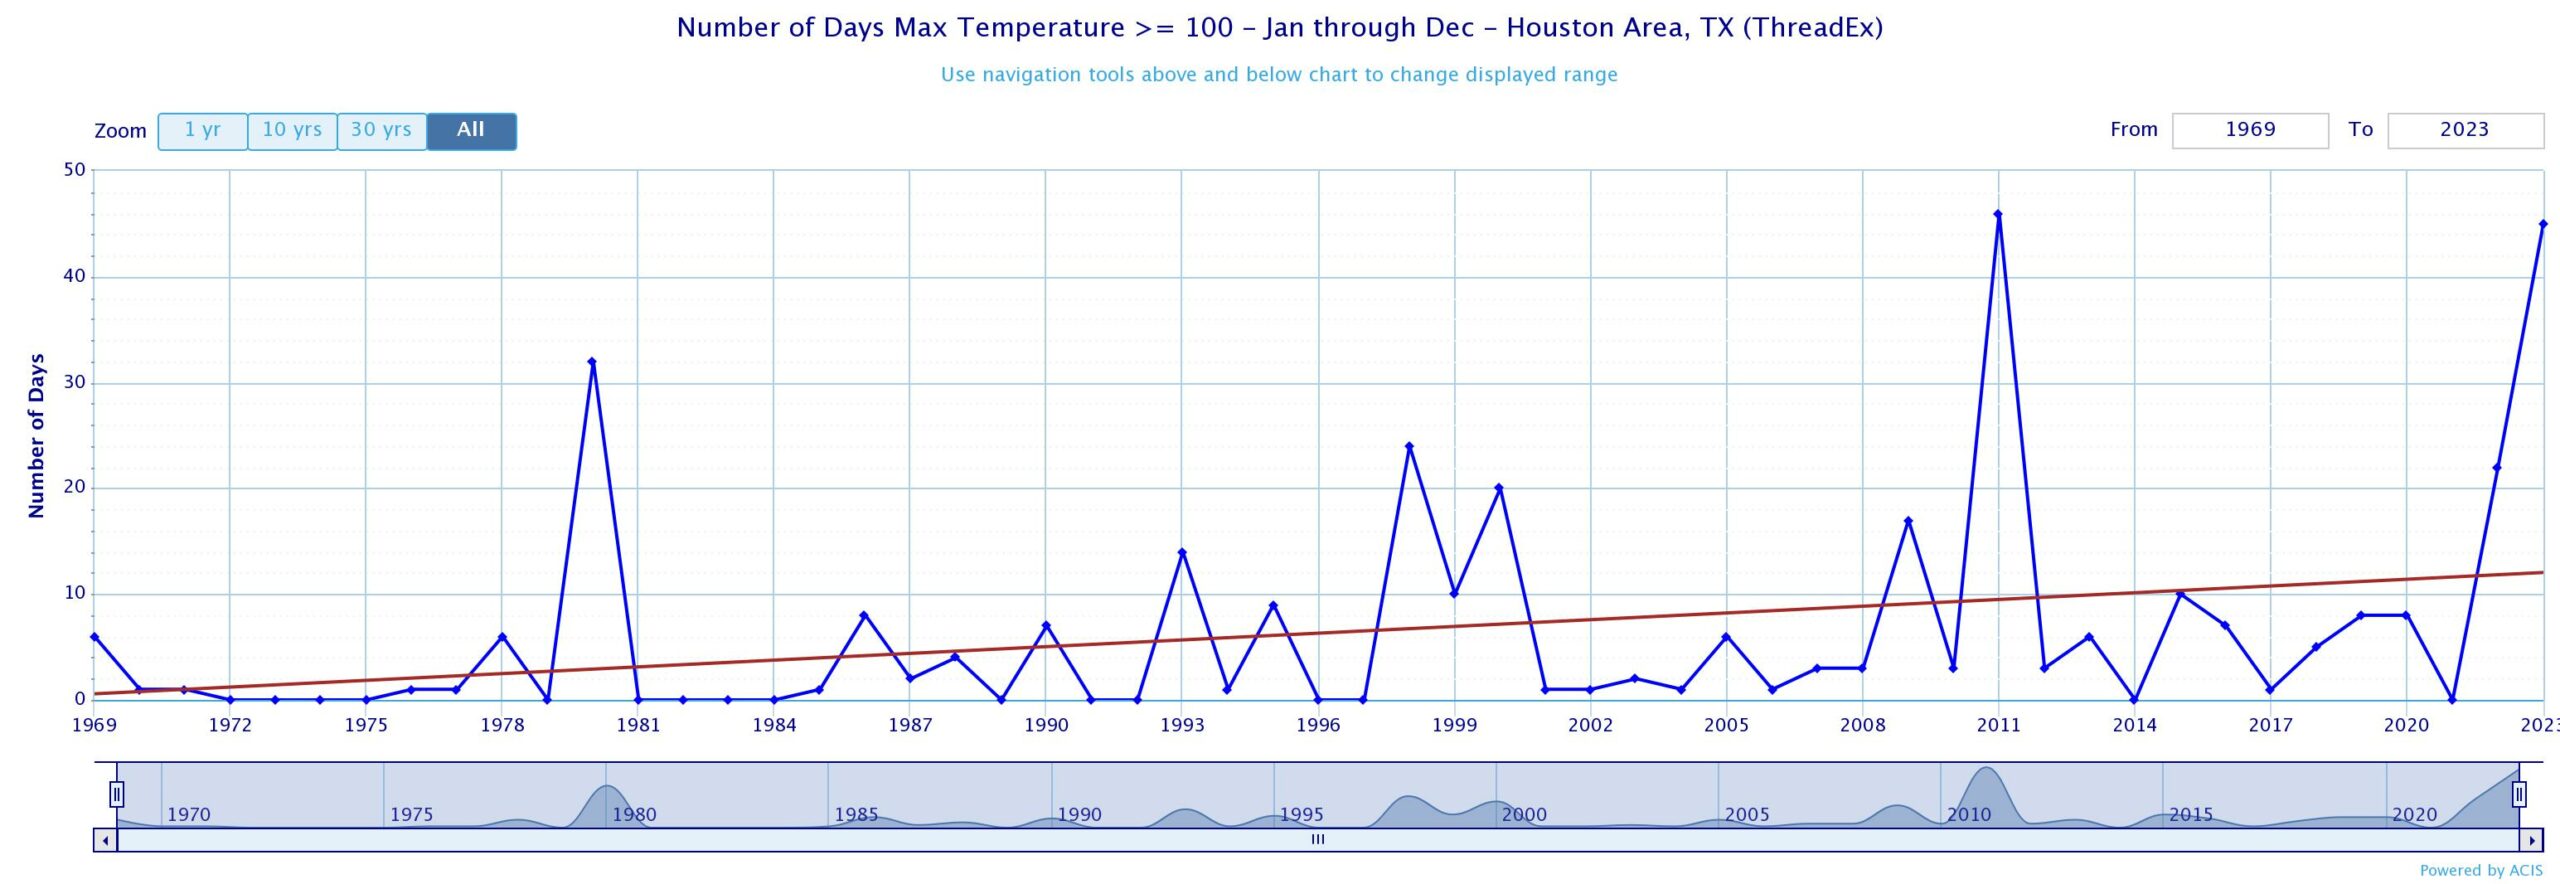
There is a clear upward trend from the 1970s and early 1980s, when it was common for there to be no 100-degree days in Houston. Now it is uncommon for there to be no 100-degree days. The average number now is 12 per year according to a simple line of regression.
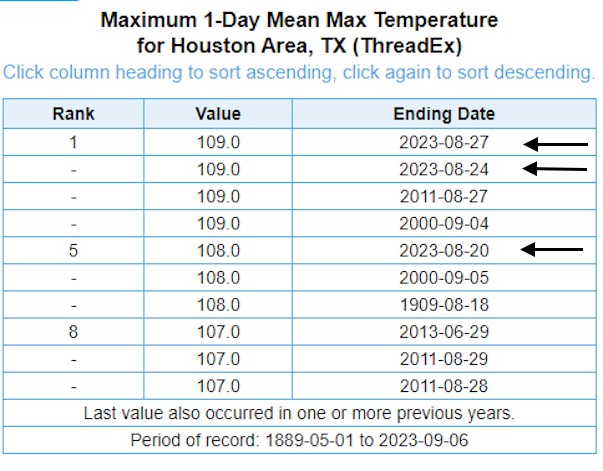
Finally, I want to share one more chart about this summer’s heat. The city’s all-time hottest temperature is 109 degrees. We tied that mark twice this summer, and three of the city’s seven hottest days on record occurred this summer. That fourth week in August was just that brutal.
Zooming in on Hobby Airport
Perhaps the most striking thing about this summer’s temperatures were not the days, but the nights. If you talk to people who have lived in Houston for a while, they’ll say that it used to cool down a bit a night. And the truth is, we are seeing fewer cooler nights. To show this I want to focus in on Hobby Airport, which is the location for which we have the longest, continuous stream of data in Houston.
First up is a look at the average low temperature during the summertime months of June, July, and August at Hobby Airport. If we look at nights there is a striking rise from the 1930s, when the average low temperature in the summer was about 72 degrees at night. Now the average low temperature is 77 degrees at night at Hobby Airport. As a matter of fact, during this summer we went 90 straight nights without a low temperature reaching 72 degrees.

Now I want to share the most eye-popping chart I made while looking over temperature data from Houston this past summer, compared to earlier years. It concerns 80-degree nighttime temperatures. These used to be a rarity. Hobby Airport did not record a single 80-degree minimum until 1953. That is to say, the low at Hobby had always fallen below 80 degrees at night for the previous 20 years. After that, 80-degree nights remained a relative rarity until the turn of the century.

And what happens after the turn of the century? The number of 80-degree nights skyrockets in a curve that looks almost asymptotic. This year there were 57 days of nights with a minimum temperature of 80 degrees or higher. Put another way, there were more 80-degree nights this year than there were from 1930 through 2007 at Hobby Airport.
So yes, if if feels like the summertime nights are warmer in Houston, you’re not wrong. Unfortunately you’re very, very right.
What are we to make of this summer
I am a meteorologist and not a climate scientist, so I asked Andy Dessler, a noted climate scientist and professor of atmospheric sciences at Texas A&M University, what to make of the striking upward trend in 80-degree nights at Hobby Airport. Here’s what he said:
In analyzing the strong upward trend, I think the dramatic behavior is due to the metric used. When we’re looking at temperatures above a specific threshold, such as 80°F in this case, you can often see abrupt shifts, even if the average nighttime is just slowly increasing. The stark surge we’re observing is likely because in the last few years we’ve dramatically increased the chance of reaching 80°F. As the temperatures continue to rise, this abrupt increase will plateau when we hit 90 days.
As for the general upward trend in nighttime temperatures at Hobby Airport, they are being driven in part by a warmer Gulf of Mexico. Sea surface temperatures this year (and most recent summers) have been a few degrees above normal. We feel this influence most keenly at night, with the warm onshore breeze counteracting the cooling effect of cloudless nights. More from Dessler:
The observed temperature patterns can be attributed to several factors, and a warmer Gulf of Mexico is definitely one of the important contributors. Also remember that rapidly warming nights have been a longstanding prediction of climate science. This is a consequence of the enhanced greenhouse effect. The energy for the surface during the day comes from the Sun and the atmosphere (the greenhouse effect). At night, it’s just the atmosphere. So increasing the strength of the greenhouse effect has a bigger relative effect during the night, while during the day it’s not as important because you’re getting a lot of energy from the Sun.
When looking at changes in temperature, it is always difficult to tease out the complexities of natural variability, the urban heat island effect due to a growing metropolitan area, and a warming planet. But it’s not like development around Houston’s Hobby Airport surged at the turn of the century, when we started to see an uptick 80-degree nights. That area has been fairly well developed for many decades. So what we’re seeing there is a strong signal from climate change.
We can have reasonable disagreements about the precise causes of the warming outlined above, and what to do about it. But the data is the data. It is not perfect, but it is telling us something important. This summer, in fact, it seemed to be shouting at us.


Thanks for the thorough analysis!
Love reading through all the data — definitely helps my understanding of why this summer felt sooo hot and uncomfortable for so long!
Forget figuring out if you want to live in a red state or a blue state, Figure out if you want to live in a white state or a brown state.
(I think white wins….)
I hope you’re talking about the mean temperature map.
Bruh
“Worst?” People live here cause they like the heat. Some of those hundred degree days looked uncomfortable from inside the air conditioning. But we ventured out into them plenty too. It’s the cold, when it occasionally happens, that is the absolute worst. Anyone who doesn’t feel that way, and willing to risk hurricanes to be part of it, would be happier in another latitude.
Worst in terms of heat compounding the drought, yes. But a valid point there, regarding a lack of hurricane activity.
Wind shear is a likely cause for less hurricanes. We got plain lucky this time.
People live here for jobs. The weather is not an attractive trait for Houston.
OP is unhinged for that take lol
lol friend you are delusional. Maybe SOME people do, but you’re off your rocker if you think Houston’s climate is something a majority of people ENJOY
I live here because I was born here and I’m tied here by a job, a mortgage, family, and kids in school. If it were just that easy to move away, I would have done it years ago. Quit speaking – incorrectly – for everyone else.
Screw this city’s weather. We live in America’s taint, and we have the weather to show for it.
Sorry pal: I live here because my dad got a job here in the 90s. I live here because I have a good job here. I don’t live here because I like the heat!
I can assure you, people don’t live here cause they like the heat. Not most of us, at least. Maybe this heat would be nice if we lived on a white sand beach with turquoise water, but there’s nothing nice about 109 temps in a swamp.
Ha! I’ve lived in Texas for all of my 53 years and I have no problem saying this one was absolutely miserable. Even people I know who say they love heat and hate cold were wanting to tap out by July.
I am torn. The dry high pressure system helped on my project (painting) and kept us hurricane free. OTOH, it was hot as Hades, and bad for every living thing! I guess, a compromise can be reached.
How does the overall variation link up with ENSO cycles? any correlation in the data with barrels of oil consumed per day (proxy for fossil fuel use)? EIA have that data. Permian Basis started ramping up post-2000. Any correlation with the methane release?
So many different connections to explore!
Eric this was a fascinating look at the summer temps thanks for sharing with us. I like when data is out there to help confirm or refute the anecdotal feeling of what is going on. The night temp data is even more dramatic then I felt the summertime had been. Good stuff and thanks again.
Has Dessler heard of this? Or does it not fit his opinion?
https://en.wikipedia.org/wiki/2022_Hunga_Tonga%E2%80%93Hunga_Ha%CA%BBapai_eruption_and_tsunami#Assistance
Large volcanic eruptions can inject large amounts of sulfur dioxide into the stratosphere, causing the formation of aerosol layers that reflect sunlight and can cause a cooling of the climate. In contrast, during the Hunga Tonga–Hunga Haʻapai eruption this sulfur was accompanied by large amounts of water vapour, which by acting as a greenhouse gas overrode the aerosol effect and caused a net warming of the climate system.[73] One study estimated a 7% increase in the probability that global warming will exceed 1.5 °C (2.7 °F) in at least one of the next five years,[74] although greenhouse gas emissions and climate policy to mitigate them remain the major determinant of this risk.[75]
Hi Max. If you’re interested, we wrote about Hunga Tonga earlier this summer.
https://spacecityweather.com/what-was-the-hunga-tonga-eruption-and-is-it-causing-our-extreme-summer-heat/
Near term data suggest its going to get even hotter. I have thought about relocating to get away from climate extremes but so far only came up with San Diego and that’s California so forget that. Gulf coast dweller for 72 years and hate the cold more than the heat. You can find shade in the outdoors to escape heat but you can’t do that with cold.
Shade doesn’t protect you from high dew point air. While the ambient temperatures are not great here during the summery times of year, it’s most commonly compounded by accompanying high dew points.
Great read and it makes me wonder, how much does the clearing of trees to make room for more housing and business have to do with rising temperatures?
Thanks for all the wonderful information! Good article!
I usually don’t use this word, but this summer truly was unprecedented. The fact that this summer beat the 2011 summer temperature wise in most places is beyond insane, because we had a relatively mild start in summer this year and a wet/mild spring. In 2011 we entered June already in D4 drought conditions with record heat. We pretty much knew we were in for hell that summer. This years summer was unforeseen. To go from no drought at all to D4 in just 2 months truly frightening. I have seen an alarming amount of dead and dying trees where I live in Brazoria County, just as bad if not worse than 2011 strangely enough. Also the urban heat island effect does play a part with warmer nights, but overnight temperatures are averaging warmer even in rural areas. At the Angelton airport most summer nights used to be in the low 70s with a few exceptions. Now most summer nights average in the mid to upper 70s with more nights failing to drop out of the 80s than before. Thankfully we live in the 30 degree latitude range and can still get relief from the fall and winter, but unfortunately these hellish summers are going to keep happening more and more frequently and hotter I’m afraid.
I’m not sure I understand the Hobby minimum temperature graph. You referenced 80 degree nighttime temps but I don’t see where the data shows an 80-degree minimum. Can you help me understand? Thanks.
Here’s a direct link to the graphic that shows an increasing prevalence of 80-degree minimum temperatures at Hobby.
https://spacecityweather.com/wp-content/uploads/2023/10/chart-14-scaled.jpeg
The earth is 100% warming, but when we worry about cars and planes and forget about the fact Houston is built on a literal swamp and all the large swathes of trees the city cuts down for progress and another parking lot, I can’t really sit here in good conscious and blame it on transportation. Kingwood just lost a bunch of trees on the corner of Northpark and the 59 feeder not only does it look like absolute garbage but how much heat and carbon did the trees absorb. Atascocita feels like a skillet now on 1960 with the widening project making it unrecognizable, it’s only a matter of time before the woodland hills drive farm is sold and they strip that too. but don’t mind all the empty storefronts throughout every part of the city just build new ones.
It’s important to note that most of Houston was tall grass prairie, and trees were relatively rare until you got to the edge of the Piney Woods (around the neighborhoods you referenced.) We almost certainly have more trees around the whole city today than we ever did prior to major settlement. the Houston area used to have wildfires about once per year that would prevent woody plants from gaining any foothold.
Interesting, put me in the boat of skepticism. I believe the heat island effect whole heartedly. I’ve lived in the area for the last 60 years. I ride my motorcycle from Pasadena to Angleton area regularly. Soon as I get past Pearland on 288, the temp drops a good 10*. All the concrete that’s been poured in the area holds onto the heat longer and has increased the flooding. I’m definitely no scientist here but do believe the earth goes into different cycles every so often. Are we contributing to more pollution, yes, but not near as bad as other countries. Keep up the good work.
Do these trends also appear in Gulf cities like Beaumont, Lafayette, and Lake Charles that are somewhat similar climates and distance from the Gulf?
I was working at the forecast offices at Baton Rouge and Lake Charles during the transition from manual readings from instrument shelters over grassy areas to automated sensors close to airport runways during the modernization of the mid 90s. Anecdotally, I noticed overnight lows on cloud free nights failed to capture lower temperatures of ground based temperature inversions when newer equipment higher off the ground closer to heat absorbing concrete was used.
Thank you for this analysis (as dispiriting as it is).
The fact that so many well educated and well meaning people are resisting the obvious is concerning. Thankfully the economics are starting to favor low carbon solutions. The opinions will not matter much longer when people take their pocketbook into account.
Stopping global warming is never going to boost GDP. All the politicians who pretend that we can get richer and save the environment at the same time are kidding themselves. Renewable energy is not much more sustainable than fossil fuels, at least currently. It doesn’t matter how much the government subsidizes them. The only clear way to stop destroying the environment is to stop using so much energy.
I think, as warming gets worse, people will see and indeed are seeing the obvious, and that will be their motivation.
There have also been multiple days where 2023 could have shattered records if something that seemed like a miracle didn’t happen. Starting July, there were some storms that added some slight moisture to the ground and thus a break from near 100 degree temperatures for a little while. Unfortuntely that relief was short lived as high pressure once again returned in mid to late July and as the calendar flipped to August. The 8th month was… a month for Hobby Airport. Each consecutive 100 degree day by 100 degree day, every storm that tried to at least give the slightest amount of relief only ended up with heat advisories turning into excessive heat warnings, as any precipitation, IF any, was completely futile and instead only increased the hunidity making the already extreme heat feel worse. Not only days were affected, but also nights of course. On the night of August 15-16, the temperature was completely refusing to cool down at Hobby Airport until the weak front came through, allowing the now drier air to rapidly cool down from 86 to drumroll….. 80 degrees. Another incident is both of the record breaking/tying days. If it weren’t for the temperature dropping storms that came right after the front’s passage on Aug 24 and 27, there would’ve likely been a window for the all time high of 109° to be broken. Even with the terrible luck we had this summer, some very lucky things have happened that prevented it from being an even bigger disaster than it already was. The torrid summer of 2011 was once seen as a historic, thousand year event. Little did we know, those thousand years were only twelve.
Question: How has the way we measure climate related data points (e.g. temperature, humidity, etc.) changed? I am curious to know what the accuracy is of todays instrumentation compared to 20, 50, 100 years ago? Also, how has the official measurement process changed, does the measurement device have to be in a particular enclosure? Thermocouple vs RTD vs thermistor vs mercury thermometers? Above ground an exact amount? Direct sunlight exposure? I am not trying to “de-bunk” any theories, but correlate data from 100 years of history with more rudimentary tools compared to what we use today. I also appreciate the history of the “official” weather stations, this is helpful data. Great post, we all appreciate data and facts.
Our planet is a large space ship, traveling through uncharted regions.
The climate has changed, both large changes and small changes, many many times over the millions of years that Earth has been in existence.
Since the dawn of mankind, the constant theme has been “adaptation”.
And that is what we will continue to do.
For those who decry internal combustion engines, they eliminated a huge problem of manure stacked six and seven stories high in many big cities in the 1800s:
https://courses.seas.harvard.edu/climate/eli/Courses/EPS101/Sources/Last-class/the-hope/The-Great-Horse-Manure-Crisis-of-1894.pdf
And now we need to move on from combustion engines because they are wrecking our planet. Not just the climate but digging deeper and in more remote places for oil. Let’s not even mention wars started or continued because of oil.
A hot summer, yes, very much so. I would be more interested in looking at this year in comparison to others down the road – in two or three years. Then, short-term and long-term trends can be noted. This summer is quite literally an end-member.
I would also be interested in backing out the ever-increasing effect of the urban heat island. Promoting growth and the covering of every natural surface with concrete and asphalt has gone on year-by-year. Unless we can find a way to reasonably hold constant the various other influences on our summer season temperatures vs what we would like to investigate, we really can’t talk about trends or reasons. Therefore, we’re back to the observation that it was a hot summer within the bounds of recent recordkeeping.
As an addendum, I would be interested in knowing if there is a connection between our hot summer and the blessed lack of hurricane activity in the western Gulf this year. I’m aware of the increased wind shear, but I don’t know how that connects, if at all, to the summer heat.
At any rate, I’d rather have heat that hurricanes.
Eric and Matt have talked it in others posts. The high pressure heat dome that kept us so hot and dry also shielded us from tropical activity, effectively steering those systems around or away from us.
Yikes! 😵💫
Lol, exactly!
The weather is nonlinear, chaotic and difficult to forecast past ten days or so. The climate even more so. There are Bond events, Heinrich events and Dansgaard-Oeschger events which have shifted our climate relatively quickly in our geologic past. There is a current study that forecasts a huge dump of freshwater from the Beaufort Gyre may disrupt the ocean currents in the North Atlantic and bring about a rapid climate shift. In my lifetime there was the 1976 Great Pacific Climate Shift which clearly impacted our weather here in Houston. We went from a colder stretch of winters in the 1960’s and 1970’s to the hotter more humid ones with warmer nights.
I do not doubt the physics behind AGW but I am skeptical of anyone claiming a specific weather event is the result of man made global warming. This past summer was an anomaly and not the new norm. Whatever natural cycles that have caused the previous ice ages and interglacial periods will continue to do so.
Wonderful work! We are soooo lucky to have you! 💜
🍂👻🍂
Please continue with these Eyewall deep dives into weather patterns and events.
In my years of inner city gardening I was very aware of warm nights; not a new thing for me to have 80 degree plus overnites where I have lived a few miles west of downtown. I gave up growing tomatoes, because they will not make blossoms above 90 degrees, and the blossoms need cool nights below 70 to set fruit. Temps in the 50’s will damage the plants, and forties will just about kill them. While friends of mine farther out of the city could grow tomatoes, in my inner city location there just aren’t sustained temps within the range of mild conditions that tomatoes need.
By the way we are likely to be seeing fewer hill country peaches as time wears on. Seems to me they peaches have already been of smaller size and lower quality that I remember in the past. I have read that conditions have changed so that the area now has barely enough “chilling hours” that peaches need to set fruit, and peach orchards are being torn up and replaced with olives, which can better tolerate warmer drier conditions. Growers are expecting changing conditions years into the future.
Thank you for the in-depth analysis and explanation!
A slightly sideways question. Do the Hobby records have hourly values for the naturally ventilated wet bulb? Or psychrometric wet bulb? Are any statistics available for wet bulb?
Curious how lack of rainfall impacts nightly low temps historically. It was an exceptionally dry summer and suspect that many of the nightly high temperatures were impacted by this. Would be interesting to see correlation between summer rainfall and nightly low temp. In other words, high temperatures this summer were greatly impacted by lack of cooling, afternoon rains.
I think being in drought actually tends to increase the difference between nighttime temps and daytime temps, because the lack of rain means less lush vegetation. The lack of green vegetation decreases transpiration, which makes the air drier, which cools off and heats up faster than more humid air.
The comments on this post are so very Houston.
We really are just a bunch of nice people trying to make sense of stuff while a load rubes who would sooner drink a pint of diesel than a cup of water on a record day tell everyone they know better.
Either way, nice write up, Eric. Hope these all-hat no-cattle basement dwellers make ya laugh from time to time.
Back in the 80’s we didn’t have NEAR the amount of concrete we do now. We had more trees, more grass fields etc. Now days, developers just bulldoze everything and lay concrete. It’s obviously a huge factor in all of this.