Now that we’re in the middle of October, and summer is pretty much over, we’re publishing a review of what the region has experienced since the beginning of June. In short, it was the city’s hottest summer on record, and one of the driest. The end of such a brutal summer is one of the reasons why we’re excited to celebrate Fall Day this year—we’re all grateful for the onset of fairer weather. Please join us from 4 to 6 pm on Sunday at McGovern Centennial Gardens. If you’d care to let us know you’re coming, you can do so here.
I am going to break down this Summer 2023 review into an introduction about the data, and three sections. First up is a big picture look at what the region experienced this summer, in terms of temperature and rainfall. Second is a more granular look at the Houston area, and some of the specific trends that concern me the most. And finally, we’ll talk a little bit about what made this summer so hot, and what is causing these trends to occur.
About the data
To be clear, when we say hottest this is measuring “average” temperature, in the sense that you take a daily high, a daily low, and the average of that is that day’s mean temperature. When you do that over the course of a month, this June was the seventh hottest on record for Houston with an average temperature of 85.1 degrees, July was the second hottest, and August and September were both the hottest on record. September’s average of 85.3 degrees absolutely smashed the previous record of 83.9 degrees, set in 2019.
Secondly, let’s be clear about what “on record” means. Houston has recorded weather data since 1881, although records are only available since 1889 due to the loss of earlier data. The “official” weather station has moved around some as the weather office moved in downtown before finally reaching its present location at Bush Intercontinental Airport in 1969. Here is the complete lineage of official weather data in Houston.
- Cotton Station (July 1881 – September 1909)
- Stewart Building at Preston and Fannin (September 1909 – February 1926)
- Shell Building at Texas and Fannin (March 1926 – August 1938)
- Federal Building at Franklin and Fannin (August 1938 – May 1969)
- Intercontinental Airport (June 1969 – Present)
Given that the station has moved some, there is a bit of danger in comparing records from before 1969 to the present. But there are some work-arounds for this. Most notably, the National Weather Service has collected data at Houston’s Hobby Airport since 1930 (with the exception of the years during World War II). We’ll see later in the post how this is useful to looking at trends over the course of nearly a century. Ok, enough of a preamble, let’s look at the data for this summer.
Big picture overview
Thanks to persistent high pressure over the United States, this was the warmest summer on record for much of the Southern United States, including large swathes of Arizona, Texas, Louisiana, and Florida. Here is a map showing the ranking of the average temperature this summer during the three-month period of July through September
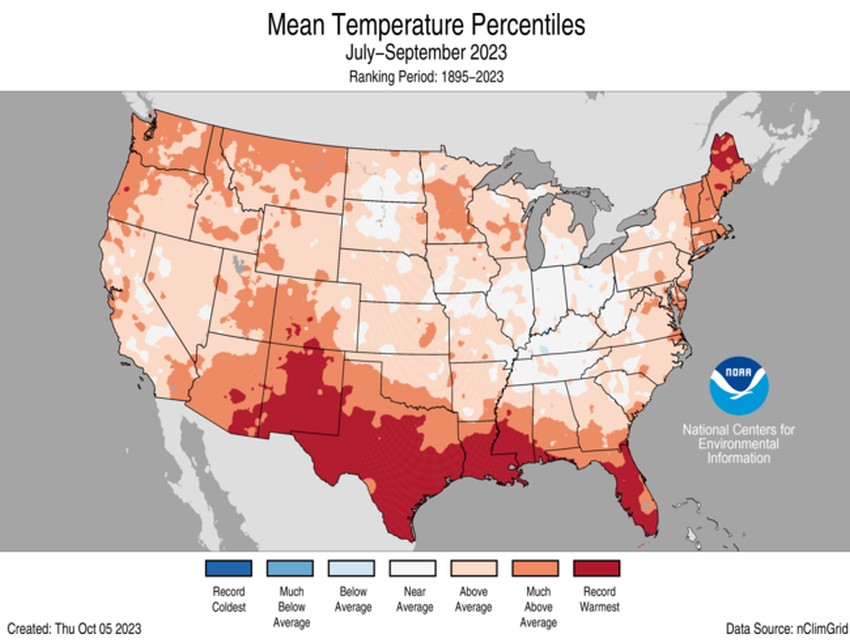
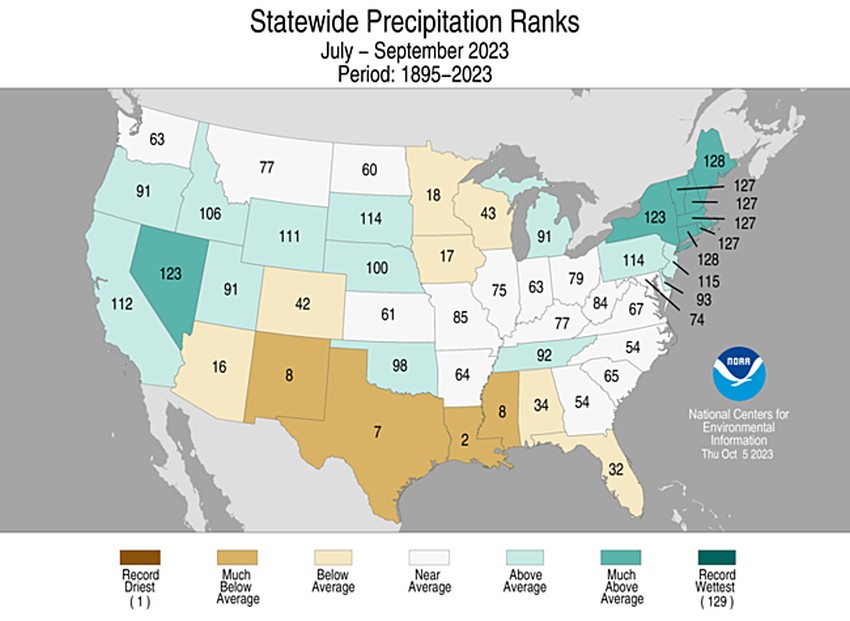
Note this data from NOAA’s National Centers for Environmental Information, and includes records dating back to 1895. A similar, though not quite as devastating trend occurred with precipitation. For Texas, this was the seventh driest on record, and for the Houston area it was among the five driest summers on record. What saved us from a truly terrible drought was a fairly wet spring.
Now let’s take a look at trend data for the Houston area. First up is the average temperature for the summer months of June through September, at Houston’s official monitoring location. An upward trend is clearly discernible, as the average summer temperature in the 1890s was 81 degrees, and it is now above 83 degrees. Also of note, this summer’s mean temperature of 87.3 degrees eclipsed the previous record set in 2011, 86.7 degrees.

One other thing I’d like you to note. See that dip in temperature starting in 1969? That corresponds to the move of the official weather station to Bush Intercontinental Airport. This is further inland from the Gulf of Mexico than downtown, and therefore nighttime temperatures are generally a bit cooler at night. You can click on the image to make it larger if you like.
I also want to share a graphic that shows a time series of 100-degree days in Houston. Note that there were 45 days this year with a maximum temperature of 100 degrees, which is one below the record of 46 days set in 2011.

Once again we have to consider the bias of Bush Intercontinental Airport. Because it is further inland, it tends to have warmer daytime temperatures than areas closer to the coast. So let’s zoom in to just the period of record from 1969 to the present day.
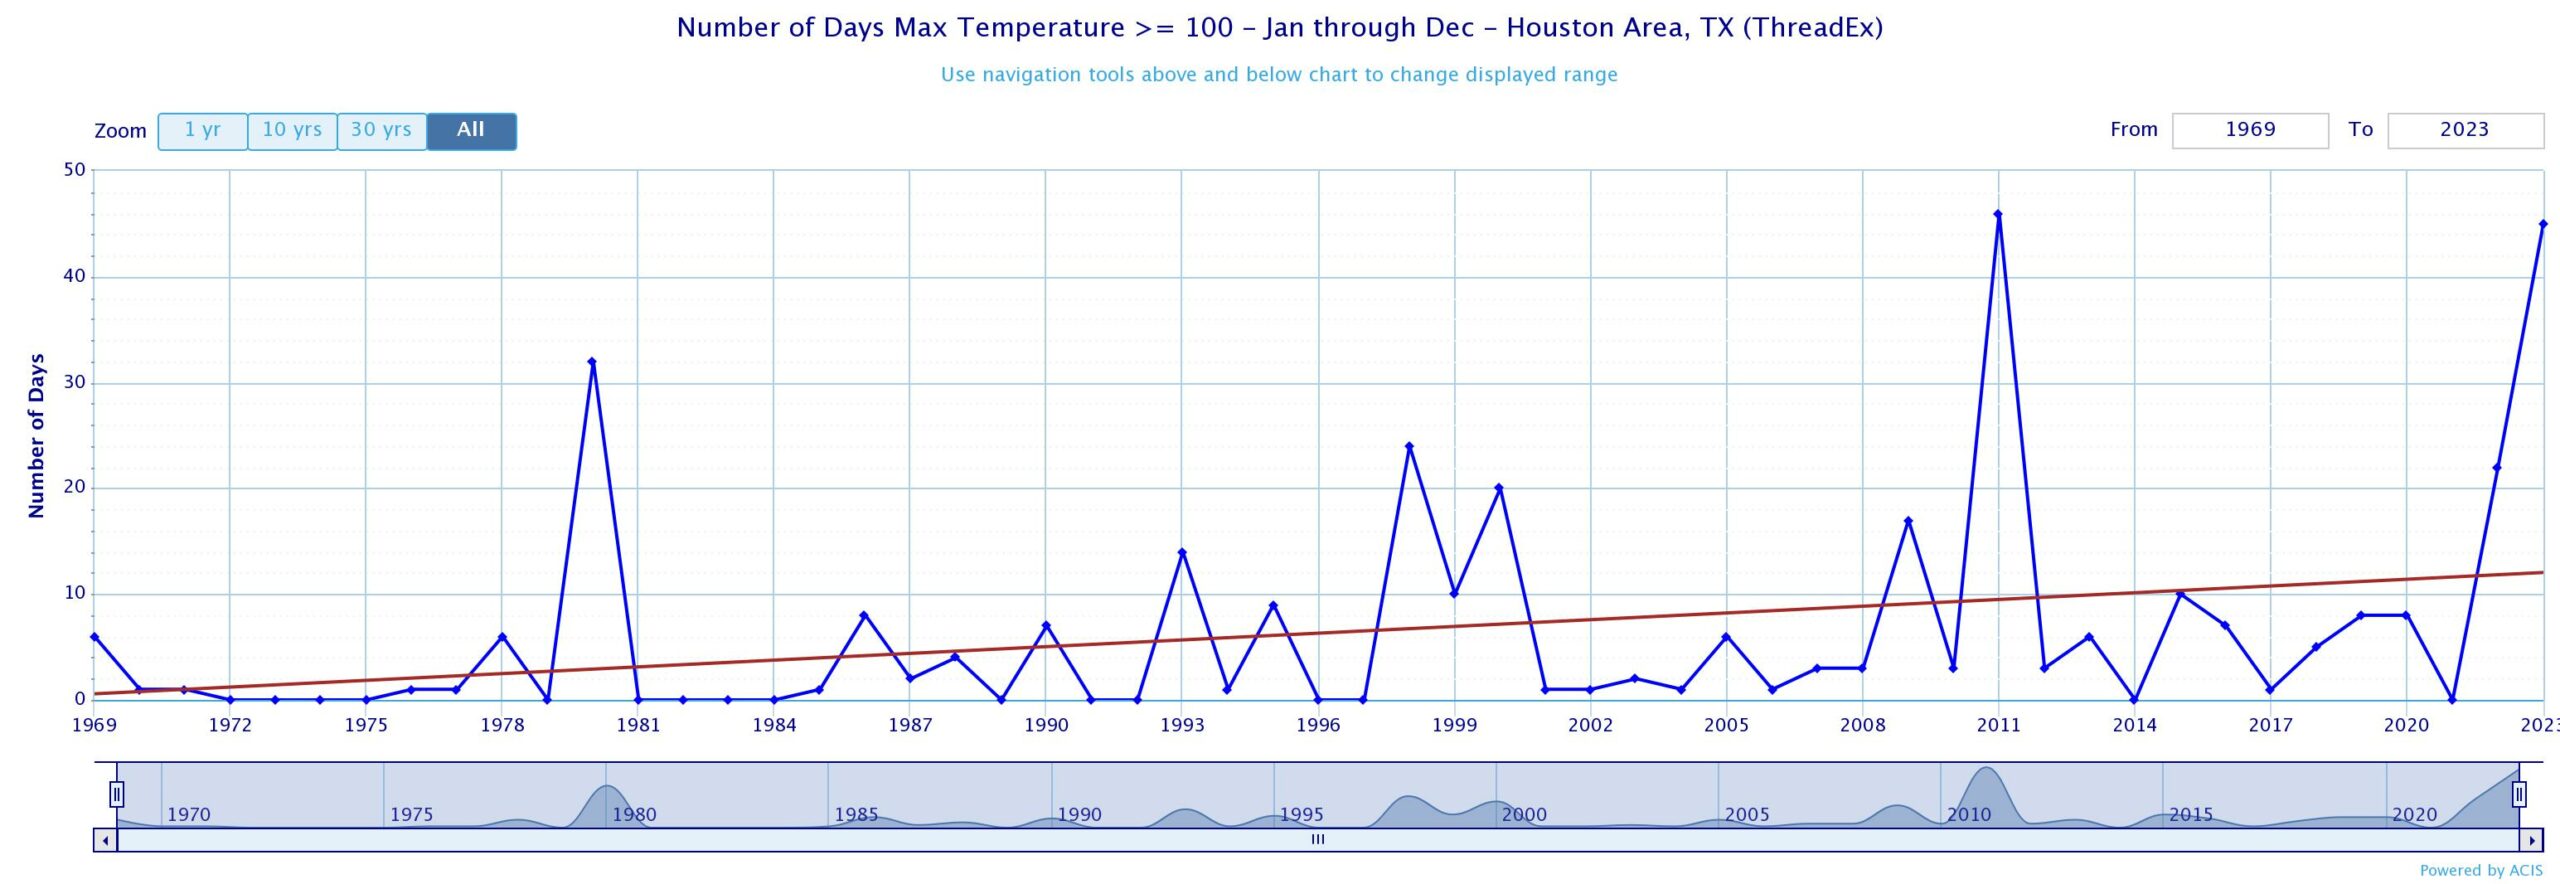
There is a clear upward trend from the 1970s and early 1980s, when it was common for there to be no 100-degree days in Houston. Now it is uncommon for there to be no 100-degree days. The average number now is 12 per year according to a simple line of regression.
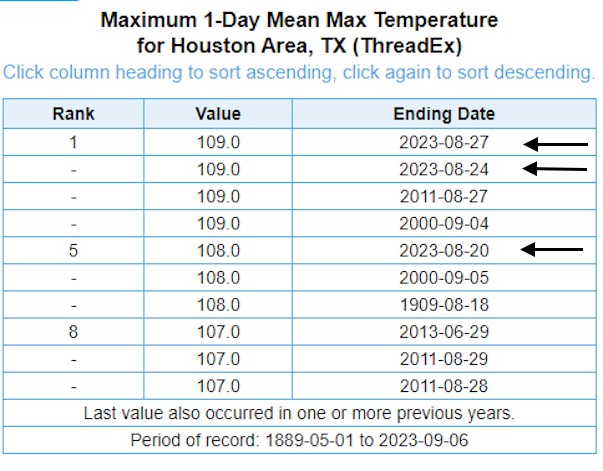
Finally, I want to share one more chart about this summer’s heat. The city’s all-time hottest temperature is 109 degrees. We tied that mark twice this summer, and three of the city’s seven hottest days on record occurred this summer. That fourth week in August was just that brutal.
Zooming in on Hobby Airport
Perhaps the most striking thing about this summer’s temperatures were not the days, but the nights. If you talk to people who have lived in Houston for a while, they’ll say that it used to cool down a bit a night. And the truth is, we are seeing fewer cooler nights. To show this I want to focus in on Hobby Airport, which is the location for which we have the longest, continuous stream of data in Houston.
First up is a look at the average low temperature during the summertime months of June, July, and August at Hobby Airport. If we look at nights there is a striking rise from the 1930s, when the average low temperature in the summer was about 72 degrees at night. Now the average low temperature is 77 degrees at night at Hobby Airport. As a matter of fact, during this summer we went 90 straight nights without a low temperature reaching 72 degrees.

Now I want to share the most eye-popping chart I made while looking over temperature data from Houston this past summer, compared to earlier years. It concerns 80-degree nighttime temperatures. These used to be a rarity. Hobby Airport did not record a single 80-degree minimum until 1953. That is to say, the low at Hobby had always fallen below 80 degrees at night for the previous 20 years. After that, 80-degree nights remained a relative rarity until the turn of the century.

And what happens after the turn of the century? The number of 80-degree nights skyrockets in a curve that looks almost asymptotic. This year there were 57 days of nights with a minimum temperature of 80 degrees or higher. Put another way, there were more 80-degree nights this year than there were from 1930 through 2007 at Hobby Airport.
So yes, if if feels like the summertime nights are warmer in Houston, you’re not wrong. Unfortunately you’re very, very right.
What are we to make of this summer
I am a meteorologist and not a climate scientist, so I asked Andy Dessler, a noted climate scientist and professor of atmospheric sciences at Texas A&M University, what to make of the striking upward trend in 80-degree nights at Hobby Airport. Here’s what he said:
In analyzing the strong upward trend, I think the dramatic behavior is due to the metric used. When we’re looking at temperatures above a specific threshold, such as 80°F in this case, you can often see abrupt shifts, even if the average nighttime is just slowly increasing. The stark surge we’re observing is likely because in the last few years we’ve dramatically increased the chance of reaching 80°F. As the temperatures continue to rise, this abrupt increase will plateau when we hit 90 days.
As for the general upward trend in nighttime temperatures at Hobby Airport, they are being driven in part by a warmer Gulf of Mexico. Sea surface temperatures this year (and most recent summers) have been a few degrees above normal. We feel this influence most keenly at night, with the warm onshore breeze counteracting the cooling effect of cloudless nights. More from Dessler:
The observed temperature patterns can be attributed to several factors, and a warmer Gulf of Mexico is definitely one of the important contributors. Also remember that rapidly warming nights have been a longstanding prediction of climate science. This is a consequence of the enhanced greenhouse effect. The energy for the surface during the day comes from the Sun and the atmosphere (the greenhouse effect). At night, it’s just the atmosphere. So increasing the strength of the greenhouse effect has a bigger relative effect during the night, while during the day it’s not as important because you’re getting a lot of energy from the Sun.
When looking at changes in temperature, it is always difficult to tease out the complexities of natural variability, the urban heat island effect due to a growing metropolitan area, and a warming planet. But it’s not like development around Houston’s Hobby Airport surged at the turn of the century, when we started to see an uptick 80-degree nights. That area has been fairly well developed for many decades. So what we’re seeing there is a strong signal from climate change.
We can have reasonable disagreements about the precise causes of the warming outlined above, and what to do about it. But the data is the data. It is not perfect, but it is telling us something important. This summer, in fact, it seemed to be shouting at us.