Good morning! The thermometer topped out at 101 degrees yesterday officially in Houston, which tied the record for June 23rd, last set in 2009. It’s hot, it’s going to continue, but we still think next week will be slightly, if not much improved. More on all that in a second.
The most common questions we have been getting of late are two-fold: “How similar is this summer to 2011?” (the epic drought summer), and “Does a hot June portend a hot July and August?” Let’s start with the 2011 comparison.
First off, while the drought is not as severe, 2022 has been hotter than 2011. The May 1-June 23 period checks in at an average (high + low, divided by two) of 83.4°, which smashes the record of 81.8° set in 2011 and again in 2018. The difference between 2011 and 2022 at this point is the extremeness of the heat. We are lagging 2011 in terms of warm temperature records set. But the consistency and persistence of stronger than normal heat is ridiculous. Our last below normal day was June 3rd. Depending on exactly how next week shapes up, we should see our hottest June on record this year.
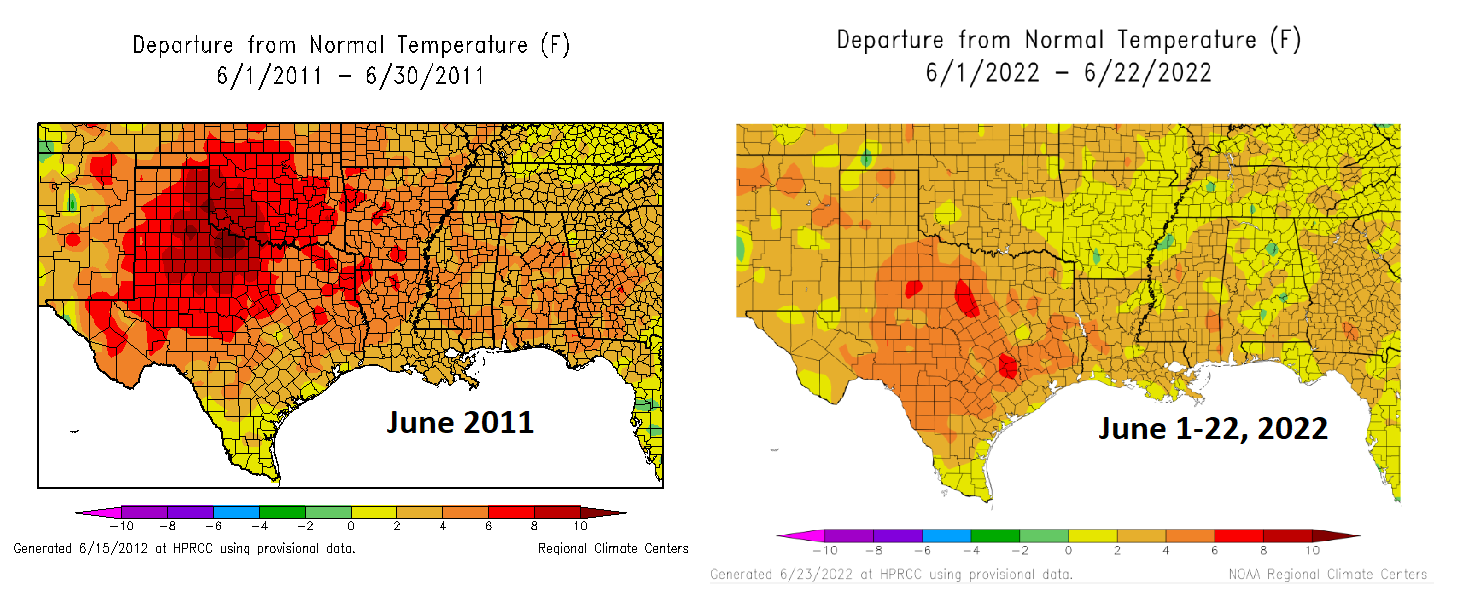
Interestingly, 2011 was hotter during the daytimes, but June 2022 is running almost 2 degrees above 2011 at night. And don’t even get me started on Galveston. The Island has set or tied *33* warm low temperature records just since May 1st. These are signals consistent with climate change, urban sprawl, and a very warm Gulf in our backyard.
The second question about whether we can derive any insights for the rest of summer based on June’s outcome is a little trickier to answer. In general, what occurs in June has very little in common with July and August outcomes here in Houston. We can see this on a scatter plot, which simply compares the June average temperature on the y-axis with the July average temperature on the x-axis.
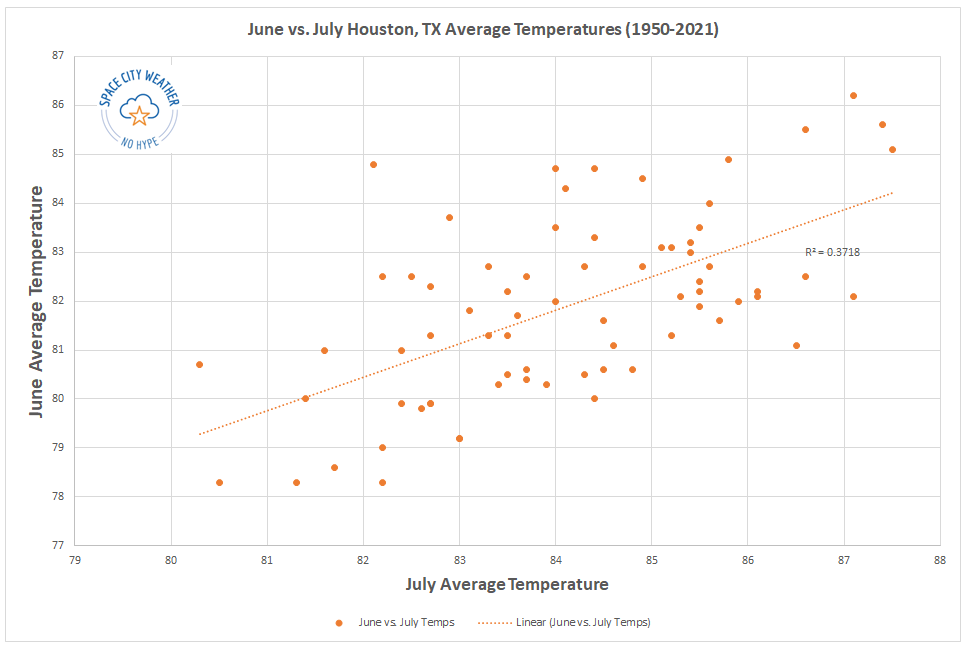
The chart above shows June vs. July in Houston. A June vs. August or July vs. August chart would not look too dissimilar. There’s definitely a loose correlation (hot Junes do favor hot Julys), but it’s pretty weak overall.
Now, what if we just look at some more significant drought summers. Drought would typically imply a stable pattern, much like we’ve seen this year. So I went back and looked at the Texas averaged Palmer Drought Severity Index (PDSI) by month back to 1950. I parsed out the March through May values and extrapolated out an approximate June 2022 value. In other words, I looked at a drought classification for all of Texas between March and June and found the 13 closest matches to 2022. Does that change the outcome? For July it does, significantly so. Remove 2011 from the sample, and there is virtually no correlation whatsoever.
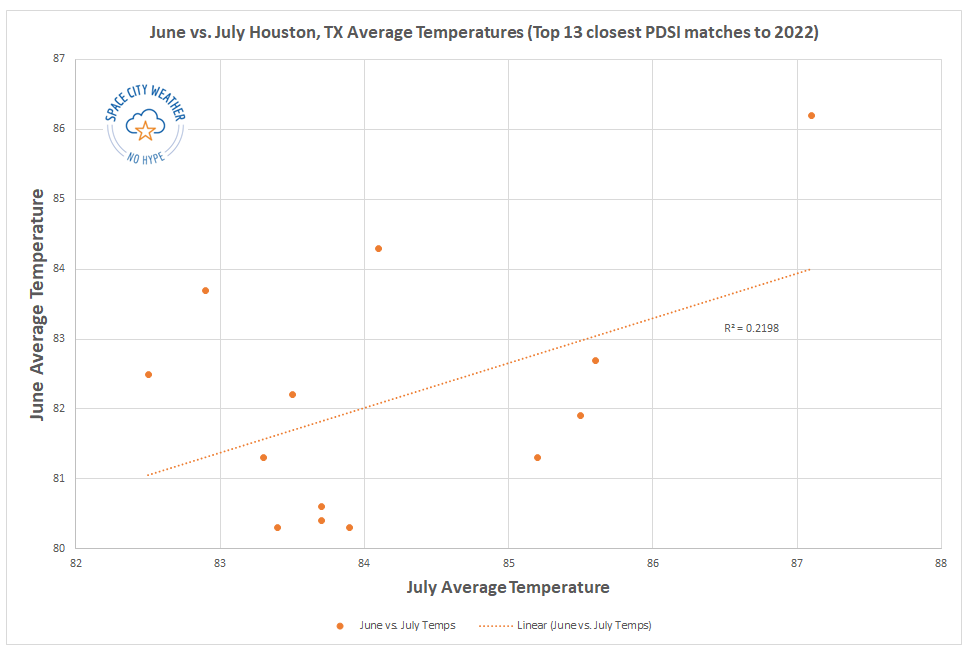
But what of August? That story appears a bit different.
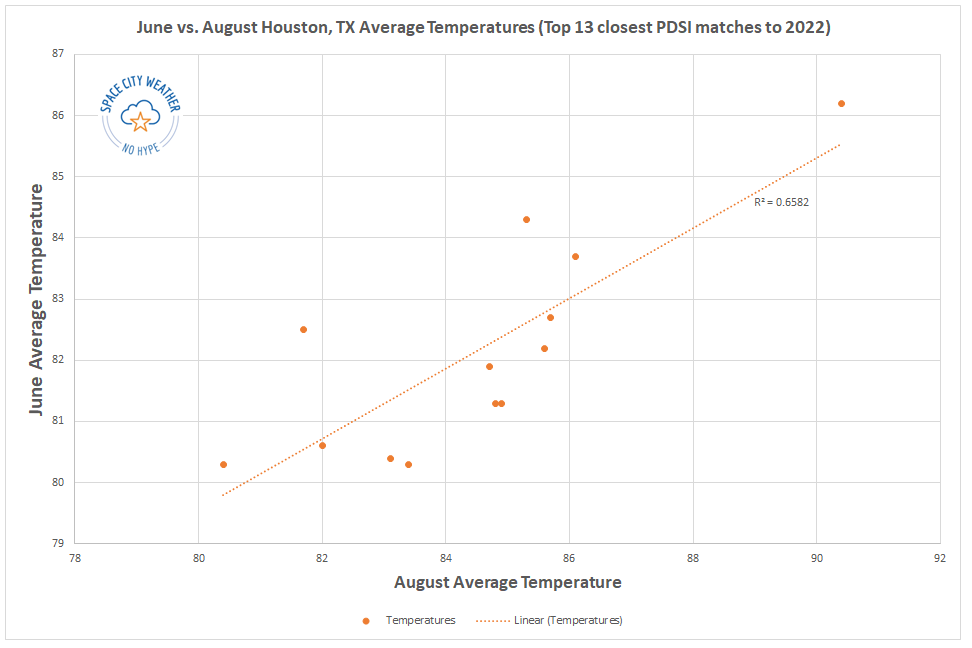
While there is a very nice correlation showing up here, a sample size of 13 summers feels just a little too small to say anything definitively. In fact, if we again remove the hottest outcome there, 2011, it cuts the R^2 value almost in half, implying a much weaker correlation.
What is the takeaway here? A hot June tells us very little about the subsequent July outcome other than it may also tend to be on the hotter side. A hot June in a drought year may also slightly favor a hot August outcome, but the sample size is too small to say anything with confidence. So, if you are hoping that the rest of summer is not as abnormally hot as June, you do have at least some hope here.
Drought update
With new burn bans and water restrictions being issued daily across the region, a look at the drought map explains why.
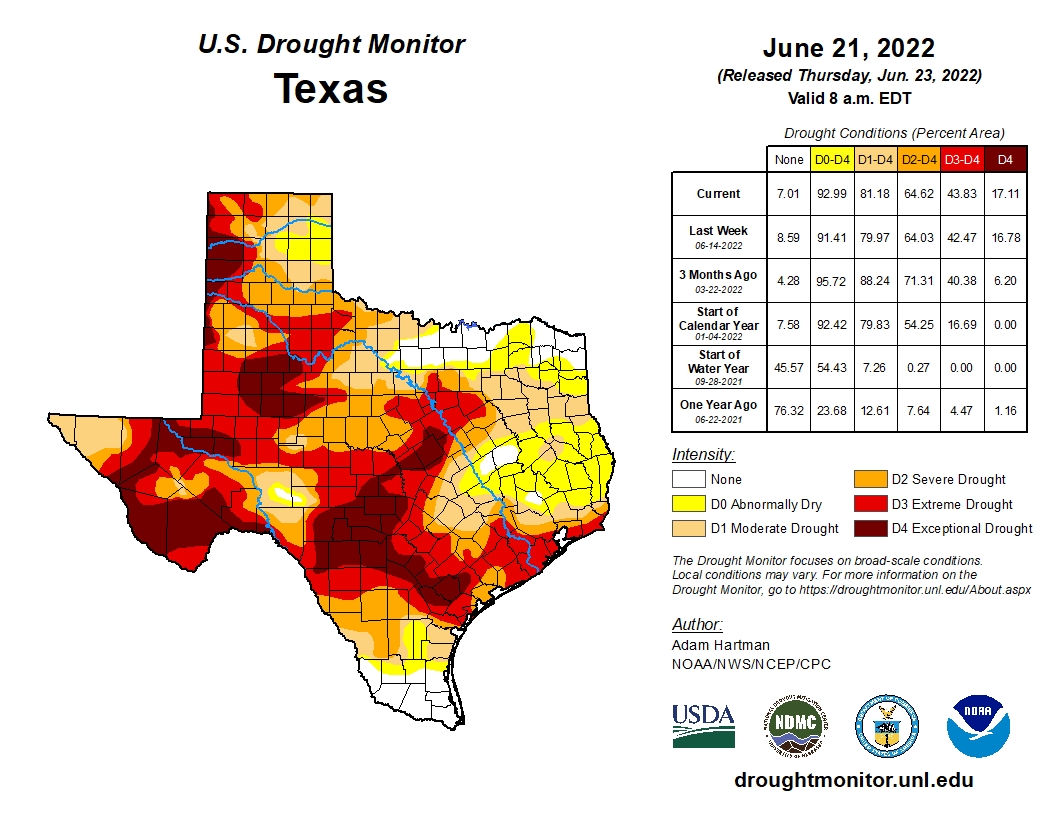
The coverage of drought changed little across our area with yesterday’s update, and the southern half of the region remains in D3, or extreme drought conditions. But we continue to receive minimal relief. That may change next week, however.
Today through Sunday
Hot, hot, hot. Look for temperatures near 100° or hotter each afternoon with just the slightest chance for a shower or storm. Morning lows should be in the 70s inland and 80s near the bays and Gulf and perhaps in the Inner Loop. Heat index values should flirt with 105° each afternoon, so please use caution outdoors.
Next week: Ch-ch-ch-ch-changes
As the upper level high pressure system responsible for our scorching weekend escapes westward next week, this will open the Gulf up for daily thunderstorm chances. In any other summer, next week would not look overly impressive. Given how little rain we’ve had, however, just the chance at daily showers returning will likely make a big difference, at least temporarily.
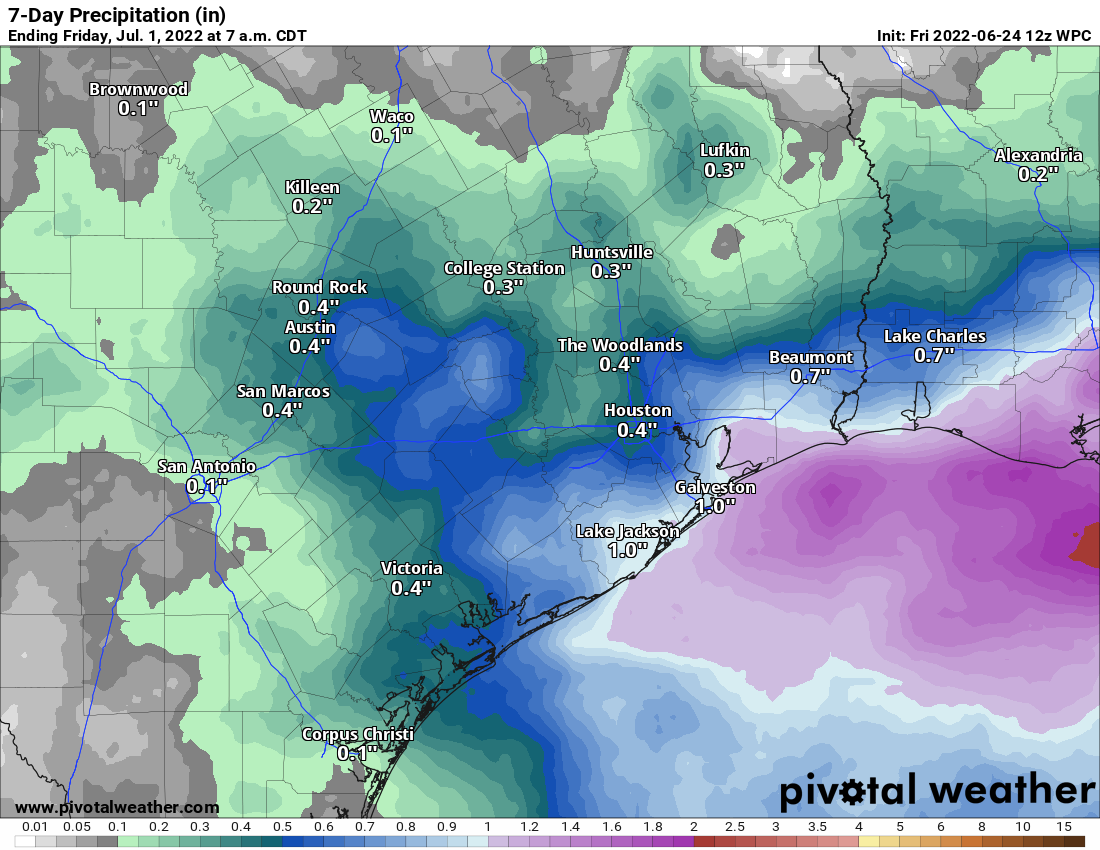
I think the highest odds for more widespread coverage of showers will be on Tuesday, Wednesday, and perhaps Friday. We’re looking at something like 30 to 40 percent coverage of showers on average each day, with perhaps a couple days seeing 50 or 60 percent coverage. This means that you probably won’t see rain every day, but most of us will see at least some rain on a couple days. Let’s hope for around a half-inch of rain on average next week, with a few more frequently hit spots picking up 1 to 3 inches perhaps. It won’t end the drought, but it will definitely help.
As a result of the showers and clouds, look for high temperatures to back off into the mid-90s or low-90s most days. Lows should remain in the 70s.
Tropics
The National Hurricane Center has increased the odds of development of a disturbance in far eastern Atlantic to 60 percent over the next five days.
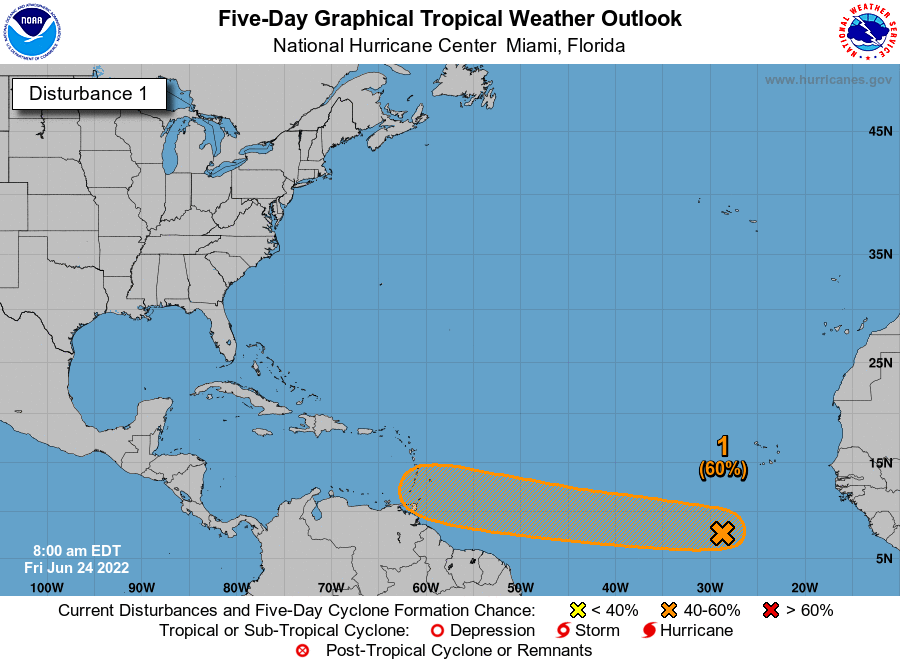
This is rather far east for a system to develop at this point in the season, so it’s certainly noteworthy. However, from a Gulf Coast-centric perspective, this has a long, long way to go. Initially, my thought is that after next week’s rainy pattern, a hotter, drier pattern is going to attempt to again re-establish over Texas for the week of July 4th, which would be about the time this disturbance makes it into the vicinity of the Gulf. A stronger system would likely turn north before getting here, while a weaker system would likely be squashed by that ridge and forced into Mexico or Central America. So at this point, I don’t view it as something to worry about, but it’s worth checking back in on after the weekend.
When did we start mapping a tenth of an inch of precipitation as a rain event?
Beggars can’t be choosers!
The same day Lake Mead water levels started making crime bosses sweat 🤣
How about Gulf temperatures, percent to normal, and correlation to hurricane seasons impacting H-Town?
Is there any correlation to the heat and then having a cold winter? It seems like when we’ve had really hot weather, at least lately, it’s followed with a winter that has a little snow. Any truth to that?
There isn’t really much of a correlation with that, but it does happen sometimes. The summer of 2009 was one of the hottest summers on record. On the flipside the winter of 2009-2010 ended up being one of the coldest on record for us. However 2011 was the hottest summer on record, and the following winter was much warmer than normal. When it comes to the weather just flip a coin and that’s what you get.
I love winter but let’s get through the heat and heart of hurricane season. Definitely a question to revisit in early Oct though.
I love winter but let’s get through the heat and heart of hurricane season. Definitely a question to revisit in early Oct though.
Regarding your correlations above–I’d be much more interested in whether a DRY June portends a dry July and or August. Hot temperatures suck, but in my mind a drought is worse. We’ve had 0.18″ of rain at my house so far this June. My water bill is through the roof I’m sure, and I wouldn’t want to see the reservoirs emptying this summer and even tall trees dying like in 2011.
Yes, please! More on sea surface temps in Carib & Gulf (June – August?) vs. any size depression or hurricane landfalling on Gulf coast.
I don’t really remember 2011 all that well, but I have noticed field lines on my property that have much more dead vegetation that I’ve ever seen. So much so that I find it hard to believe I missed them in 2011, especially while mowing the grass.
Good LORD! What a lot of fabulous info and easy to understand. You guys ROCK!
The last two entries, Thursday and today, are not showing up on the app. Is there something I need to do to update?
Same issue here.
Sometimes a cooler than normal June can lead to a brutally hot July or August. 1999 and 2000 are a good example of that.
I’d be curious to see a graph plotting US cities by Meteorology 101 test scores. I suspect Houston would be near the top thanks to y’all’s detailed reporting.
we NEED a tropical storm right now!
No we don’t
We never need a tropical storm in Houston. People that disagree have obviously never had there home flooded.