The last time we had a tropics post was back on July 13th, and since then zero storms have formed. By July 30, 2020 Isaias had formed. We’re still stuck on Elsa this year, and I hope no one is complaining. It would seem that the next week or two, broadly, will continue on this quiet trajectory. Today, we will look into perhaps why things have been so different this month compared to a year ago.
Tropical outlook in a sentence
While one can never rule out a rogue “homegrown” system this time of year from a disturbance over the Gulf or off the Southeast coast, there is no sign of any organized activity in the Atlantic over at least the next 7 to 10 days.
2021 vs. 2020
So the obvious question here is “what gives?” Why has 2021 behaved so differently from last season? Well, for one 2020 was not “the norm.” At all.

We had 30 named storms last year. The defeatist in me really did expect this season to also be very busy by now, even if it lagged 2020 by a bit. That has not yet happened thankfully, and ultimately I think it mostly comes down to a law of averages in some sense. Of course, that doesn’t explain things scientifically. Let’s look at a couple things.
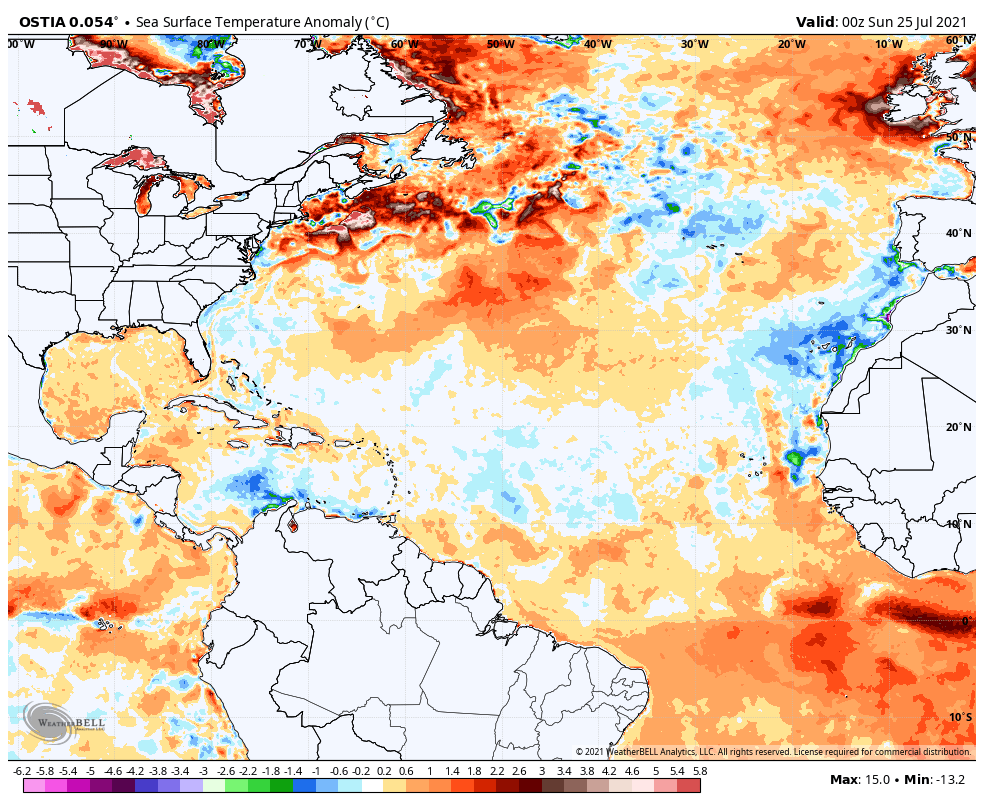
First, sea surface temperature. How warm is the Atlantic Basin right now? Well, if we look at a snapshot of recent water temperature anomalies, you’ll be able to see that we’re still a bit above normal in most of the Atlantic.

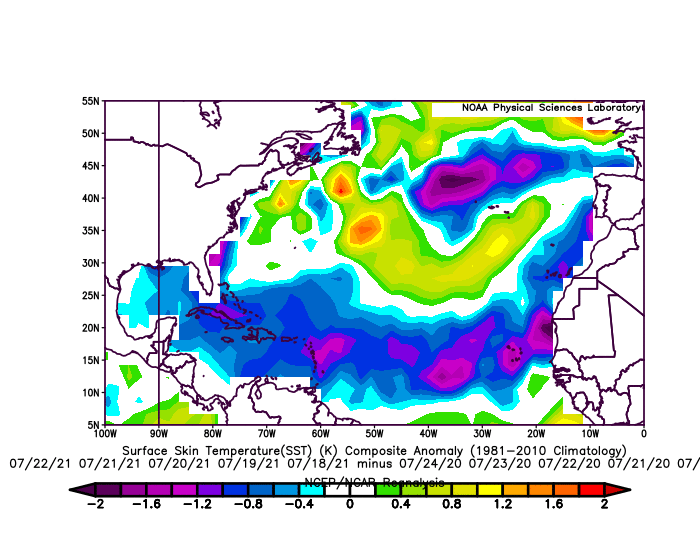
Now, granted, the water temps off the Southeast coast and in the eastern Caribbean and central Atlantic aren’t impressive. And indeed, this is notable, particularly when you look at how late July compares in 2021 versus last year. The map below shows water temperatures for the week of July 18th through July 24, 2021 minus the same week in 2020.

In some cases, we’re running 1 to 2 degrees cooler than a year ago, at least for late July. So that may be one reason why this year has lacked some of last year’s firepower to date.
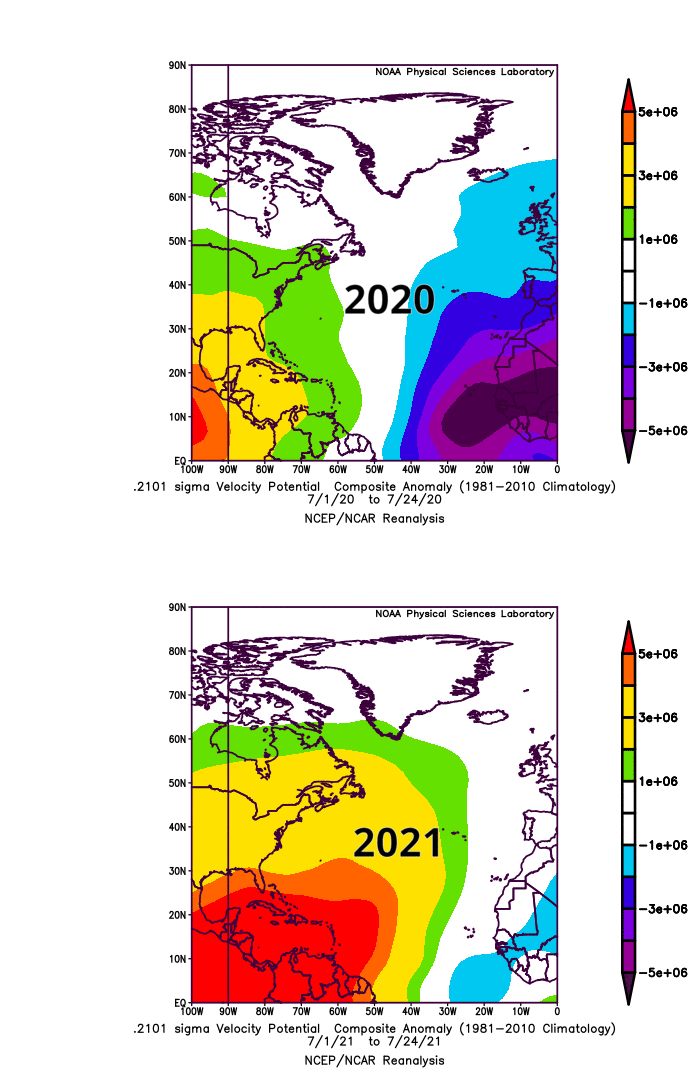
Let’s go into the meteorological weeds a bit. If we look at a metric called “velocity potential,” or “VP,” we can see a very interesting year over year difference in the Atlantic basin. Without getting too deep into things, think of negative velocity potential values as being favorable for tropical development and positive ones as being unfavorable. This is especially true if those values are over the eastern half of the Atlantic basin. Negative VP will promote more rising air & thunderstorm activity in the background, while positive VP will promote more sinking air and fewer robust tropical waves. It’s much more complex than this, but at a very high level, that explains some of the basics.

In a nutshell, the deep purples on the map above indicated a lot of smoke on the water in 2020, which ultimately meant a number of tropical systems. Edouard, Fay, Gonzalo, Hannah, Isaias, and a bonus tropical depression all formed in July of 2020. This July is likely to finish with just one storm, Elsa. Looking at the map labeled 2021 above, you can see the reds and oranges in western two-thirds of the Atlantic basin, Caribbean, and Gulf, along with much less blue and purple over Africa and the eastern basin. Thus, the background state this July has been less favorable than it was a year ago and subsequently, it’s been a fairly quiet month.
The obvious question is whether that will change. In general, based on most modeling I’ve seen, this is expected to change a bit in August to a pattern not as robust as 2020 but at least something more like it perhaps. So in addition to climatology favoring our typical ramp in tropical activity in August and September, we may get a subtle addition from the overall background state too. My gut feeling is that August will start quiet, but as the month wears on, we will have systems to watch closely, as we typically would in any hurricane season. I don’t think it will be quite at the frenetic levels of 2020 or even 2017, but to be sure, it won’t stay this quiet forever. My advice? Enjoy what we have left of the quieter conditions, and make sure you’ve got your plans and kits together for the August and September gauntlet.

It only takes one storm to ruin your year.
And the active tropics the last few years is one of the reasons investors and developers are increasingly unlikely to make investments in Harris County.
Thanks Matt! Always appreciate y’all’s info and work.
Matt,I always appreciate your deep dives into analysis!
Matt–Do you look at the MJO phase. Joe Barstardi has been very good at predicting storms when the MJO is in phase 2 and 3. That is when we had the storms earlier this year. Currently, the MJO is in phase 6, and going into the null phase. This mah help explain the quiet activity
The velocity potential maps I show here, while not a perfect 1:1 match, actually give a good sense of what impacts the MJO is having. The MJO is super complex, but, yes in general it has been hostile to tropical development this month, which partially explains things.
Another informative posting Y’all. Thanks for informing your audience.
Any comment on today’s 88th Anniversary of the “Surprise Hurricane” & the first flight into a hurricane?
Whoops, it is the 78th Anniversary of the Storm, not the 88th. I had a brain fart, sorry.
Lew: I think you and Bill Read did it some serious justice here: https://www.weather.gov/hgx/projects_1943surprisehurricane 🙂 We may tackle a post on this too eventually. If one day time allows, we’ll have lots of posts with hurricane history here.
I know this is focused on the tropics, but look at that temperature anomaly in Lake Superior!! If I’m reading that right, almost the entire lake is off-the-charts warmer than usual. That can’t be good.
Very interesting, Matt.
Thanks Matt..here’s what this ole retired rocket scientist got from today’s post…I think I need to cheer for “positive velocity”…and the “MJO” headed to null…GOT IT!!
We’ll count it!