As Harvey approaches, here’s how to prepare for inland flooding

With Tropical Depression Harvey moving toward the Texas coast, our largest concern for the region is not the wind or the potential storm surge. Instead, Harvey’s greatest impact will come from inland flooding. Current forecasts predict anywhere from 10 inches to more than 20 inches of rain during this event for parts of Texas, which may well include Houston. As the storm approaches, you should be aware of what inland flooding is, and how to prepare for it.

What is inland flooding?

When a tropical system makes landfall, it begins to deteriorate and collapse without the energy from the warm ocean to feed it. The moisture within the storm precipitates out, often in torrential rainstorms that can last for days.

Additionally, if the system moves slowly or stalls, heavy tropical downpours can lead to flood conditions hundreds of miles inland, far from the point of landfall. Tropical systems hold millions of TONS of water, and all that water falls as rain, eventually. This leads to major flooding, something Houston is all too familiar with. With inland flooding from tropical storms, it can mean—in a few extreme cases—getting 30 inches of rain, or half a year’s worth, in three or four days.

Keep in mind, wind speed of a tropical system is not an indicator of how much flooding may occur. Tropical Storm Allison never became a hurricane, and was barely even a tropical storm by wind speeds, but because it stalled over our region Houston experienced days of these heavy tropical rainstorms.

Rainfall totals from TS Allison (NOAA)

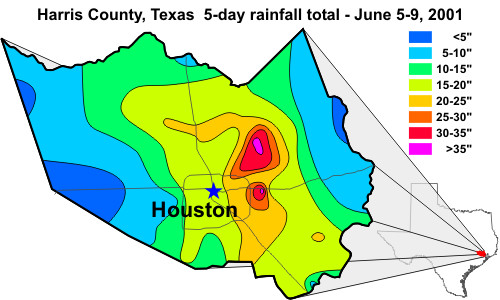
The figure above also shows the difficulty in predicting what areas will flood the most. In Harris County alone, rainfall totals ranged from less than 5 inches to nearly 40 inches during Allison. Any small change in the storm’s path or intensity is the difference between flooding or light precipitation. And to be clear, we are not saying Harvey will be another Allison, only that there is potential for severe inland flooding from Harvey.

See full post

Storm surge: a hurricane’s biggest impact

Several posts in our Weather Why series deal with hurricanes. In the past, we have discussed what affects a hurricane’s path, as well as why winds are strongest on the right side of a hurricane. As the peak of the Atlantic hurricane season draws near, we wanted to focus on the part of a hurricane that impacts people along the cost the most—storm surge.

While many people are concerned with rain, wind, and tornado risks when discussing the impact of hurricanes, the storm surge is by far the most dangerous factor. A 2014 study by the National Hurricane Center showed that 49 percent of all deaths attributable to a hurricane or tropical storm come from storm surges (by comparison, hurricane-spawned tornadoes only account for 3 percent of tropical storm and hurricane deaths). So what causes the storm surge? And when a tropical system makes landfall, what can you do to avoid it?

See full post

With summer looming, a primer on when Houston’s air quality is worst

For weather forecasters, air quality remains one of the trickier things to predict. Several factors go into making good air quality forecasts, because so many weather events influence air pollution. As Houston heats up and air quality becomes a greater concern this summer, we wanted to talk a little about what air pollution is, and the part weather plays in it.

Primary vs. Secondary pollutants

Air pollution consists of two types: primary and secondary. Primary pollution comes directly from a source, like car and ship exhaust, power plant emissions, fires, etc. Secondary pollutants, on the other hand, aren’t emitted directly into the air. Instead, chemical reactions in the atmosphere create these pollutants. Ozone, for example, forms when sunlight interacts with nitrous oxide, carbon dioxide, and other “volatile organic compounds”, or VOCs. Ozone in the stratosphere (think of the ‘ozone hole’) acts as an invisible sunscreen layer for earth, preventing UV rays from reaching the surface. However, ozone near the surface, or ‘smog’, acts as a respiratory irritant. The more sunlight we get during a day, the more potential there is for smog.

The many sources of air pollution. “Chemical transformations” are another way to describe secondary pollutant creation (Science Direct)

See full post

Why do meteorologists use different dates for seasons?

Last week, many meteorologists celebrated March 1 as the beginning of spring. Other than the “wait, did we even have winter?” reaction from some, others wondered why we say spring begins then, and not on March 21 (also known as the Vernal Equinox). The confusion stems from the two ways meteorologists classify seasons: meteorological seasons, versus astronomical seasons. What’s the difference? Why do meteorologists use one instead of the other?

Astronomical Seasons

The earth’s rotation around the sun, as well as the earth’s tilt, create the astronomical seasons. For example, at the Vernal Equinox (March 20-22, depending on the year), both the northern and southern hemispheres face the sun at the same angle. Both hemispheres, therefore, get the same amount of solar energy.

As the earth revolves around the sun, we reach the Summer Solstice (June 20-22), the earth’s tilt causes the northern hemisphere to face the sun more directly. This means longer days, more energy from the sun, and therefore, warmer temperatures. The southern hemisphere receives less direct radiation from the sun, which means shorter days, less energy, and cooler temperatures.That’s why Australia experiences winter when we experience summer.

Three months later, at the Autumnal Equinox (September 21-23), the situation is similar to the Vernal Equinox. Both hemispheres receive equal amounts of energy, and face the sun at the same angle. Finally, at the Winter Solstice (December 20-22), the northern hemisphere faces away from the sun–so the days are shorter, the sun’s energy is less direct, and therefore, the temperatures are cooler. Meanwhile, Australia bakes (more so than usual) during their summer.

Diagram of the astronomical seasons (courtesy NASA)

See full post