Note: This is the first in a series of reports by Matt Lanza that puts the Tax Day floods into perspective, and discusses what Houston should learn from this natural disaster.
On Monday afternoon the Harris County Flood Control District released its first official summary of the historic flooding that occurred last week in the greater region. I’ve read through it and compiled some highlights for here. (You can also view the report yourself in its entirety here). A serious thank you to Jeff Lindner at the flood control district who has worked tirelessly since last week to provide critical, useful, and interesting information to put this event into context and keep the region informed. He is also a must-follow on Twitter if you’re into weather, haven’t done so yet.
Report highlights
- Rainfall rates of 1″ in just 5 minutes were observed in Harris County. The maximum hourly rate was 4.7″. The maximum amount in 12 hours was 16.7″
- Harris County averaged 7.75″ of rainfall for the event. That’s equivalent to 240 billion gallons of water falling on the area. This exceeded Memorial Day (162 billion gallons) by almost 80 billion gallons of water. That event was more confined, whereas the Tax Day rains were much larger spatially.
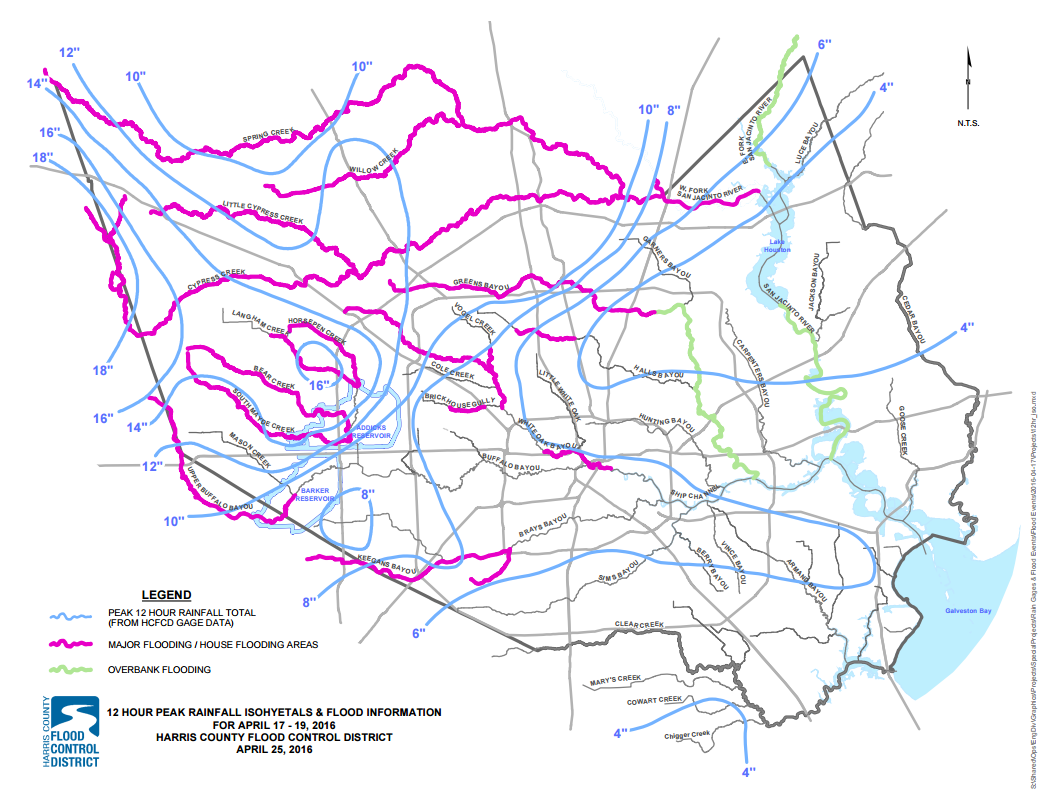
- The highest rainfall total in the region was 23.5″ recorded in 14.5 hours in Pattison, just north of Brookshire in Waller County.
- The Pattison rain total is estimated to be have exceeded the *10,000* year level (0.01% chance of occurring in any given year). It should be noted that these numbers are very tough to quantify with any level of confidence, so although the rains were off the charts, we may never truly know how much so.
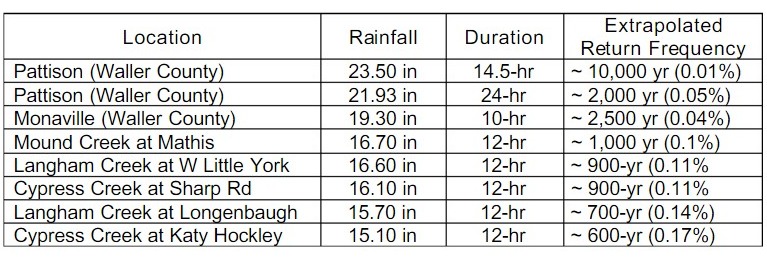
Return period for some of the most extreme flooding during the Tax Day rains. (HCFCD)
- Regarding comparisons to Allison in 2001, the maximum rainfall in that storm was 28.5″ in 12 hours on Greens Bayou. During last week’s event, the maximum rainfall was 16.7″. So for many areas, yes, this fell short of Allison levels of flooding (I have more to say on this below).
- Cypress Creek, Langham Creek, and Horsepen creek all exceeded their 500 year flood levels for a 12 hour period. The 500 year flood level is the one you have a 0.2% chance of seeing in any given year. Numerous other creeks exceeded 100 year (1% chance in a given year) levels.
- Rainfall over Cypress and Little Cypress Creeks shattered the October 1994, October 1998, and April 2009 flood event levels.
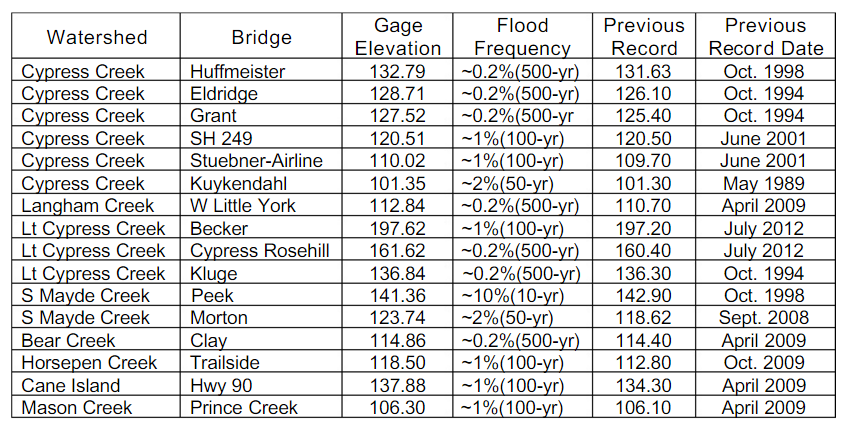
- Overland flows were 3 feet deep along Sharp Rd and Katy Hockley Rd in Northwest Harris County, making last week’s event the highest known overflow event in Northwest Harris County.
- The three creeks that inflow into Addicks Reservoir set new records for flow.
- Addicks peaked on Saturday morning at 102.63′, breaking the previous record (March 1992) by over 5 feet. 60% of the reservoir’s total capacity was filled. Barker Reservoir had 40.5% of its capacity filled. It peaked Saturday morning at 93.6′, breaking the old record by over 1.5 feet.
- As of Monday, just under 6,000 homes across the region are reported to have flood damage (of those 3,500 are in unincorporated Harris and ~1,700 in Houston).
This was truly a remarkable event, one that will be remembered for many years in Southeast Texas. Throughout the event, we heard and read numerous comparisons to Tropical Storm Allison, Memorial Day of 2015, the 1994 floods, etc. It’s made me wonder about how you can truly compare flood events here in Houston and do so effectively. Flooding is a fact of life here; it happens often, but each event is unique. Each one has its own fingerprint.
The first of a series
In the coming weeks, we want to show some past flood event comparisons. Namely, I’m curious about where the rain fell and how fast. One of the big risks in flood events is the notion that because one event doesn’t appear worse than your previous benchmark event, “it can’t be that bad.” Sometimes it really is a matter of luck: Shift a stationary rain band one mile further west and you have a totally different outcome. There is also the elephant in the room that Houston, with its enormous geographic footprint and far flung suburbs, may be seeing flooding events worsen because of our growth: A victim of our own success. It’s plausible that an identical event, had it occurred 30 years ago, would have a much less significant impact on the same places today. This is the consequence of developing and paving over hundreds of square miles of wetland and prairie that act as a natural sink for excess rainfall. In addition, although a single weather event cannot be attributed to climate change, it is expected that a warmer atmosphere will produce more intense rain storms and subsequent flooding.
Eric and I want to address these issues and, most importantly, bring to light more on the history of weather and its effects on residents here. Greater Houston has added over 1.8 million new residents since Allison in 2001. Along with natural turnover as much as half of the population in the metro area may not have lived here 15 years ago. The more we know about our flood history, the more we can understand and plan for future flood events, which are inevitable here. So be on the lookout for future posts about this, and please feel free to comment with any questions or concerns you have. We can’t answer everything, but we will tackle what we can.
You can also find me frequently on Twitter to discuss these issues.
Very interesting! Some of it is above my head (uh oh, brain is flooding?) but very well written and clear. Weather in this area must be so hard to forecast. Of course, if you guys had been around when Houston was founded maybe we would be having fewer problems with flooding now.
Thank you for helping to put things on perspective.
Interesting. Does this hold true for Montgomery County also? I live around The Woodlands and many places in this county got water that never have.
Dale,
Yes it does to a similar extent. The issue of course is that the Harris County Flood Control District is very thorough, but focused on Harris County. You can extrapolate some of the info out for Montgomery County, but I understand that can be difficult. When we tackle some of the past events, I plan to do so on a regional scale level…not just within county lines. So Montgomery County will be included.
This is great information. As a newer resident to the Houston area (2012), I love reading about some of the historical storms.
One thing that a lot of folks keep asserting is that the conversion of upland wetlands and prairies to impervious area (concrete) is the primary driver for the flooding we’ve seen. At a certain point, that depression storage in the wetlands & prairies gets full of water, which is also 100% impervious. Not to mention that new developments are generally required to detain excess runoff for the 100-year storm event.
When the rainfall rate exceeds the ability of the ground to absorb and store it, runoff is generated. I’m still convinced that the primary reason for the extensive flooding is simply that it rained hard.
There’s no question that’s true. No matter how much or how little development you have here, it will flood. Floods are a part of life in Texas. The issue is that the way things are laid out isn’t always done with enough foresight. And we have enough evidence in history that shows how paving over land exacerbates flooding somewhere. So the flooding may have been worse in some areas than it would have been 30 years ago…and it may have been the same elsewhere. We really don’t know for sure. I mean, look, we have to grow, right? We can’t stop growth. But we can do it more intelligently and with a *lot* of foresight. Of course that means you get regulations and government involved, which isn’t always popular here. But at some point you have to ask if it’s worth it to continue business as usual.
One of the issues I have right out of the gate is that we plan for 100 year events around here when it seems like it would make a heck of a lot more sense to plan for a 500 year event. I think we’ve seen enough evidence that this should be considered. And if the projections for the future with climate change are at all accurate, well then it definitely makes sense. I’d argue it makes sense with or without it though.
As a consulting engineer, I would literally be jumping at the chance to design for 500-year + events. The problem with that level of design is two-fold:
1. The periods of record for most gauges still are not yet at the 100-year mark. If our 100-year is already an extrapolation, how much more then is the 500-year? We can’t be certain that we are providing that given level of protection.
2. The local regulations specify 100-year FEMA floodplains as the standard of design because it just simplifies things. Also, the 100-year event is likely to occur in many people’s lifetimes (~50% chance in 70 years). The 500-year — not so much (~13% chance in 70 years). The political will to protect for something that may happen once in a person’s lifetime is quite lacking once one sees the cost increases of a project due to that 500-year standard.
It seems it will just take some time to make much progress on this front.
Nice reply, Jeremy! Appreciate the insight. I don’t know. I guess I just see weather as potentially crazy anyway. It seems like every day you hear from some corner of the world that “we’ve never seen that before.” It just seems like weather has the potential to be more extreme than anyone believes (with or without any contribution from climate change), and it just feels like as technology improves we should be planning for that. But I guess it all boils down to cost vs. benefit vs. risk. One day we’ll get it right.
This. You’re absolutely right
“I mean, look, we have to grow, right?”
So how’s that been workin out for ya lately Matt? I guess if your misery index is high enough you’re ok with it. I’m not though, this sure as hell isn’t the way I want to live. :-\
Looking forward to the analyses. Considering a move to Houston. All the factors need to be considered before we commit – this info will be invaluable.
Thank you for providing analysis. I’m particularly interested in the impact growth and construction had on flooding. I live northwest of Tomball, well outside of most developments, but 99 recently went up by our neighborhood and it flooded much worse than usual. I’m looking forward to reading further.
Katy definitely had the worst flooding I’ve ever seen in 43 years of my life. (I’m 43 so that’s all I’ve seen! ) 😉
It sounds like all new development should be looking at permeable pavement of some type. I know it’s a development cost, but one that may be a necessary evil as we continue to expand development.
Permeable pavement would help if we had permeable soils. The clay that underlies most of the area has a very low permeability factor. Geologically speaking, the greater Houston area is at the deep end of what was a large (very large, up to the Dallas area) bay where sediments sifted to the bottom of the water column. So the soils we have today – after the water level dropped – are predominantly clay and silt. A friend of mine from California now living in Houston wanted to put in a stormwater drainage well in his backyard to capture runoff from his roof and yard. I asked him exactly where did he think the water would go, and is he prepared to pay to have a driller create a 100- to 200-foot boring to the uppermost transmissive zone? He didn’t believe me until the utility company dug up his backyard to replace some cable, and after it rained, the trench stayed wet for days. In conclusion, please trust your friendly neighborhood geologist!
Not to minimize the historic horrible flooding in Texas, but any return period beyond the historical record is a statistical guess based on a distribution with no datapoint to fit at those long return periods. Also, and equally important, if one looks at the “previous record date”, you will note those previous record floods are all in the late 1980’s, 1990’s, 2000’s and 2010’s, after the temperature record rises sharply from global warming. Warm air holds more water vapor at saturation. The bottom line is that what is shown as 1 in 1000 year rainfalls can be expected to occur again much sooner. For example, a few years ago, there were three 1 in 100 year floods in the Carolinas in a single 2 week period. Hopefully, this mismatch will be acknowledged and accounted for by engineers.
Not to minimize the historic horrible flooding in Texas in April and now in August, but any return period beyond the historical record is a statistical guess based on a distribution with no datapoint to fit at those long return periods. Extrapolating into the unknown not only requires an accurate fit (with no data) but for the rainfall not to become more/less intense over the period. If one looks at the “previous record date” column, you will note those previous record floods are all in the late 1980s, 1990s, 2000s and 2010s, after the temperature record rises sharply from global warming. Warm air holds more water vapor at saturation. The bottom line is that what is shown as 1 in 1000 year rainfalls can be expected to occur again *much sooner* than in 1000 years. For example, a few years ago, there were three 1 in 100 year floods in the Carolinas in a single 2 week period. Hopefully, this mismatch between statistical model and reality will be acknowledged and accounted for by engineers.
As the city once again tries to “fix” this flooding problem – or atleast minimize it – have these findings been given to city planners? the corp of engineers? etc. This would absolutely make a case for something to also be done on the north side of town pertaining to Cypress Creek and Little Cypress Creek. Watching homes in my area flood three times in two years this is beyond the concept of a “500 year” flood. Every home in Lakewood Crossing subdivision flooded, many in Norchester and Lakewood Forest subdivisions. Cypress Creek and Lt. Cypress Creek destroyed homes there and everywhere that creek flows as we saw near Stuebner Airline all the way to I-45. I look forward to reading the rest of your findings and again hope these are being shared with city planners.
I have noticed you don’t monetize your website, don’t waste your traffic, you can earn extra bucks every month
because you’ve got high quality content. If you want to know how
to make extra money, search for: Mertiso’s tips best
adsense alternative