Last week’s storm system was mostly about the heavy rain and flooding, as Eric summed up nicely here. But the story that I think was most fascinating, meteorologically, was the hailstorm that hit some parts of the Houston area on Thursday night. The National Weather Service Houston office collected over 20 hail reports from the event, more than half of which were golf ball size hail or larger.
Put your car in your garage if possible or cover it with blankets. Hail pictured came down near Katy Freeway at Sam Houston toll road and the storm is headed straight to Houston. pic.twitter.com/f0prcLOuDf
— Arson (@txArson) May 10, 2019
@NWSHouston Hail from Clear Lake in last 15 minutes. Larger in the yard. Can't get to them pic.twitter.com/9EWFIjUhNI
— SETXWeather (@SETXWeather) May 10, 2019
https://twitter.com/VortexChasing/status/1126686637394518016
Houston doesn’t often get hail this big over this wide an area. So what happened here? Why did we have so much big hail last Thursday?
Houston doesn’t see a lot of hail
If you look at the map of annual average 1+ inch diameter hail days per year (this from 2003-2012), you’ll notice Houston is mostly on the outside looking in at significant hail reports.
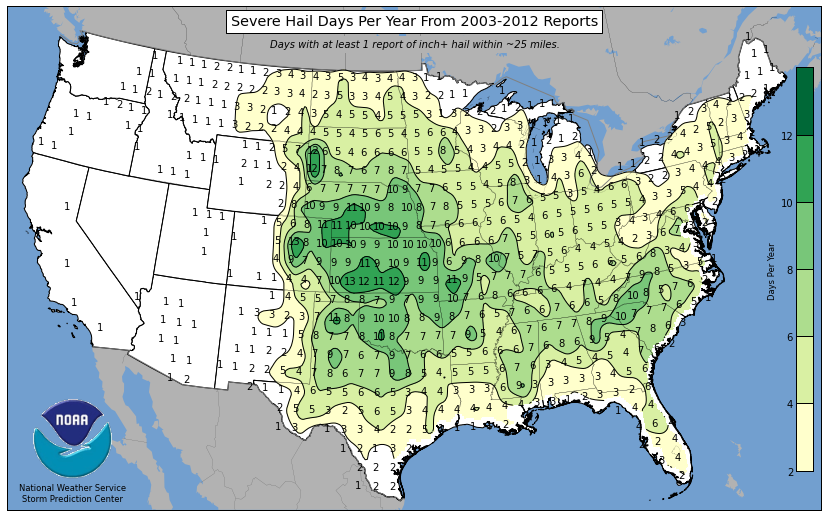
Why is this the case? For one, thunderstorm updrafts are needed to allow for the water droplets that become hailstones to get above the freezing level. Houston is a warm place, and that freezing level is often too high and the storms not powerful enough to carry those droplets high enough for large hail to form. Our lower freezing levels occur in winter and spring, making hail more likely then. In fact, of the 62 hail reports of 2″ in diameter or larger in NOAA’s storm events database since 1950 in Harris County and adjacent counties, only 3 of those reports have occurred outside of January through May. The average hail maxima is also where it is because they simply get more powerful, supercell thunderstorms with violent updrafts in the Plains.

How does hail form?
So, how do you get hail? The simplest explanation is that the turbulence within a thunderstorm allows hail to form. If you think back to when you were taught about how thunderstorms form, you may recall that it takes a lot of rising air to get them going. This is the updraft. What happens is that water droplets will get caught in this updraft and shoved up in the atmosphere above the freezing level. They become what we call “supercooled.” These supercooled droplets can affix themselves to what we call “condensation nuclei,” or really small particles like dust or soot or salt among many other things. As the droplet encounters more of these nuclei in the atmosphere, your hailstone can grow. The hailstone will travel up and down within the storm, picking up more nuclei and growing until the intensity of the updraft in the storm can no longer support the weight of the hailstone. Gravity takes over, and it then falls to the ground.
You can read more about this and find out more about how hailstones have layers and can form via wet growth or dry growth here and here.
How did last Thursday evening’s hail come together?
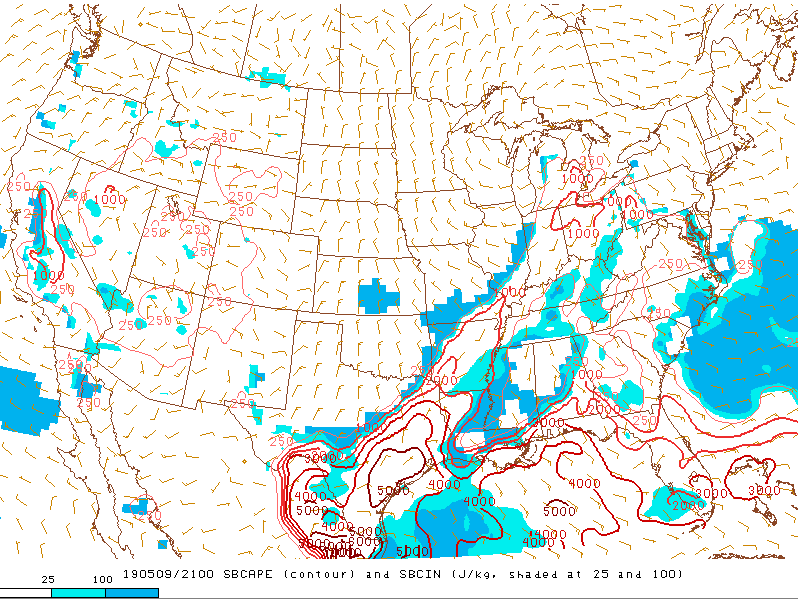
So now that we know a little bit about how you get hail, what was it about last Thursday that made it so significant? First off, the atmosphere over Houston was a powder keg last Thursday. One parameter we look at is known as convective available potential energy, or CAPE. Typically, CAPE values of 1,000 to 2,000 Joules/kilogram are needed to get thunderstorms. The analysis from the Storm Prediction Center last Thursday afternoon, implied that parts of the area may have seen values as high as 4,000 to 5,000 J/kg.
Often, when we talk about available “energy” on thunderstorm days, we are referencing CAPE. Now, CAPE alone won’t give you severe storms or any storms for that matter. Nor, will a lack of CAPE prevent thunderstorms. But on high CAPE days, some forcing or trigger is needed to get things going. And that’s what happened as some boundaries shifted into our area Thursday evening. All day, we held on to just enough inhibition or capping to prevent storms from going up. Then, as these boundaries moved in, started to collide, and interacted with the extremely unstable atmosphere overhead, it was like a dam breaking. Here was the radar at 5:30 PM Thursday compared to 7 PM Thursday.
You can see how things just exploded overhead from a few isolated showers to a bunch of supercellular type thunderstorms. According to radar at this time, the tops of these storms were reaching as high as 55,000 feet. Some storms got even taller than that. The freezing level on Thursday evening was only about 15,000 feet up, which means that as hail formed, it had plenty of space to sit in subfreezing temperatures and grow.
So of the two primary ways you can get hail, extremely strong thunderstorms or a really low freezing level, we had the former last Thursday, which allowed storms to blossom and explode.
Using radar to “see” hail: Cinco Ranch
I dug into radar imagery from last week, and I found a couple cool things to point out. Weather radar technology has advanced a lot in recent years. We get imagery faster and at higher resolution than we ever have. This means more to look at in real time. We can “see” lofted debris from tornadoes, easily tell where rain is falling versus snow or sleet, and we also have ways to confirm that hail is falling from a thunderstorm all by using radar.
One of the larger hail reports came from the Katy and Cinco Ranch areas around 8:25 PM last Thursday, when a trained spotter reported 2.5″ diameter hail, or tennis ball size hail.
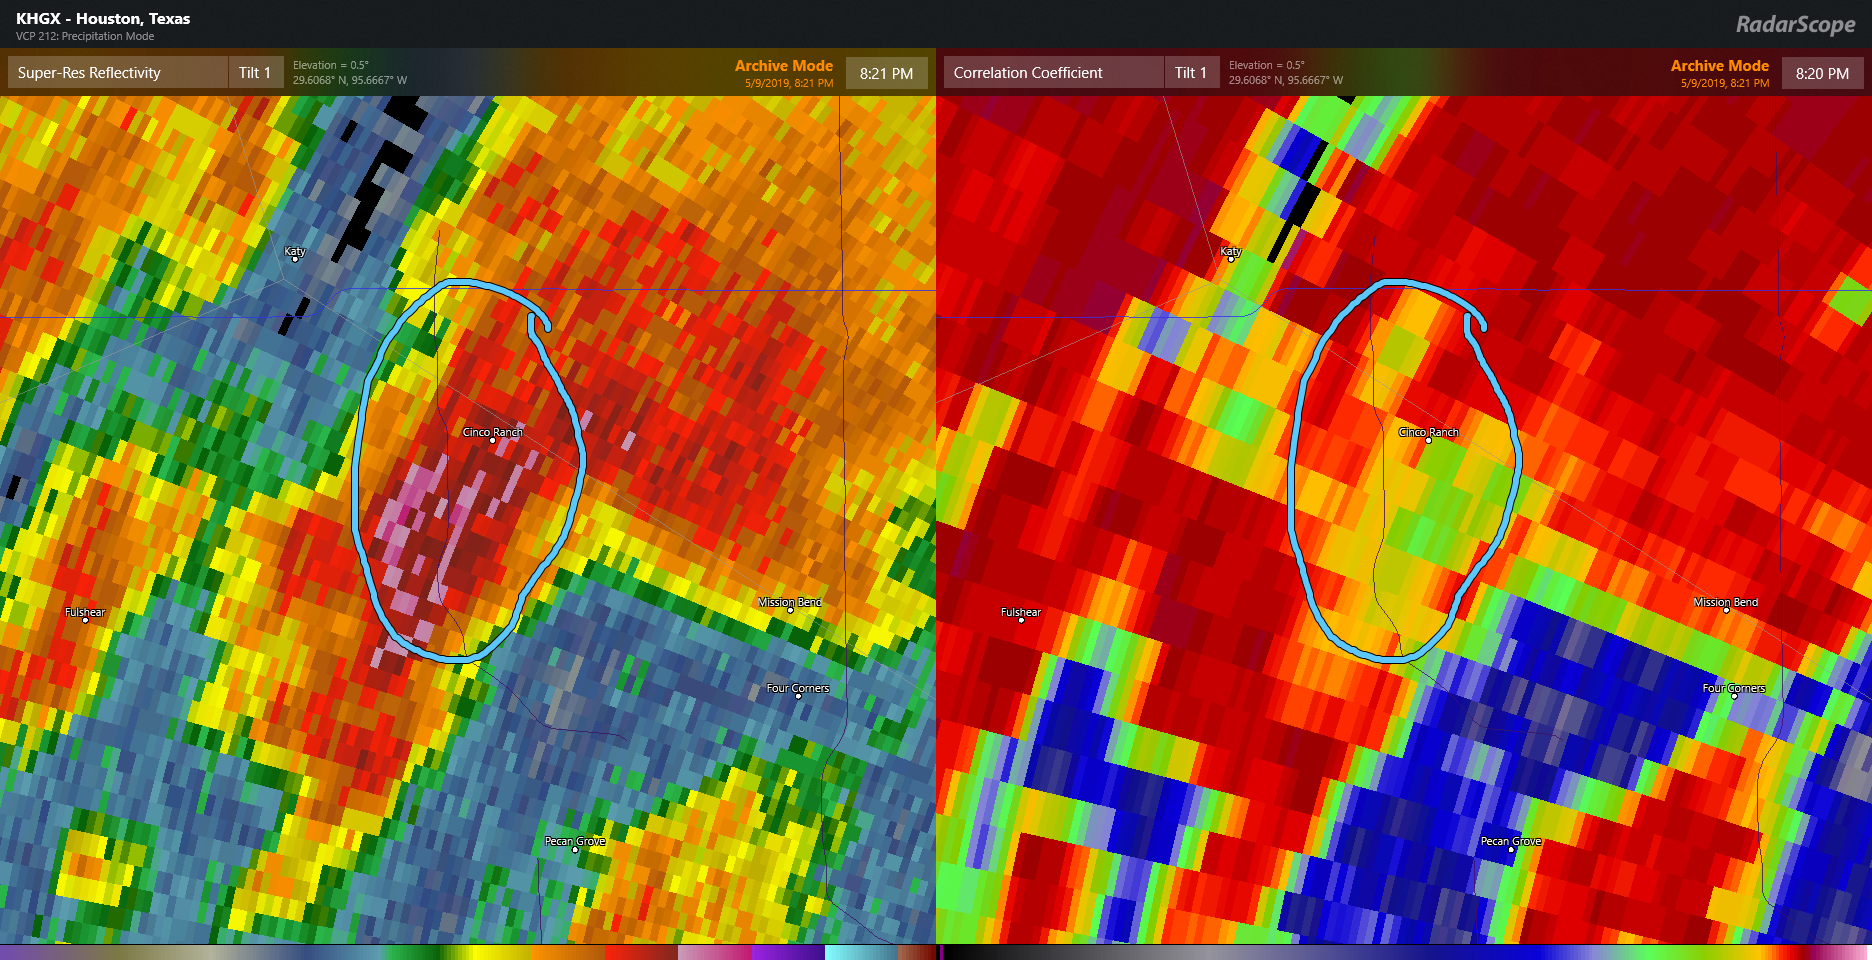
You can pick out the hail on the radar image above. On the left is the traditional radar image you would see, base reflectivity. On the right is one of the newer tools we have in the dual-pol upgrade toolkit, called “correlation coefficient.” This product is basically telling you how uniform the objects falling from the sky are at that point in time. In a straight, plain rain scenario, there would typically be a correlation coefficient around 1, indicating just raindrops. In this case, the highest reflectivity on the left coincided with a correlation coefficient around 0.8 to 0.9 (green circled on the right). That indicated that what was falling was not uniform, and that there were both raindrops and hailstones in that storm.
Using radar to “see” hail: Northeast Houston
Another good example from last Thursday’s event was from hail that occurred in northeast Houston. Specific reports were a bit sparse, but there was one 2″ diameter, or hen egg size report from Beaumont Highway & Lake Houston Parkway.
Iglesia de Dios (on the corner of Evangeline and Oates) was hit hard by hail. 💒 The children’s building and sanctuary both had windows smashed out. pic.twitter.com/ZLisNp4Bqt
— Erica Simon (@EricaOnABC13) May 10, 2019
This storm exploded over Downtown Houston around 9:30 or so and lurched north and east just outside the 610 Loop. The radar image below shows 4 panels. This is a classic example of severe hail.
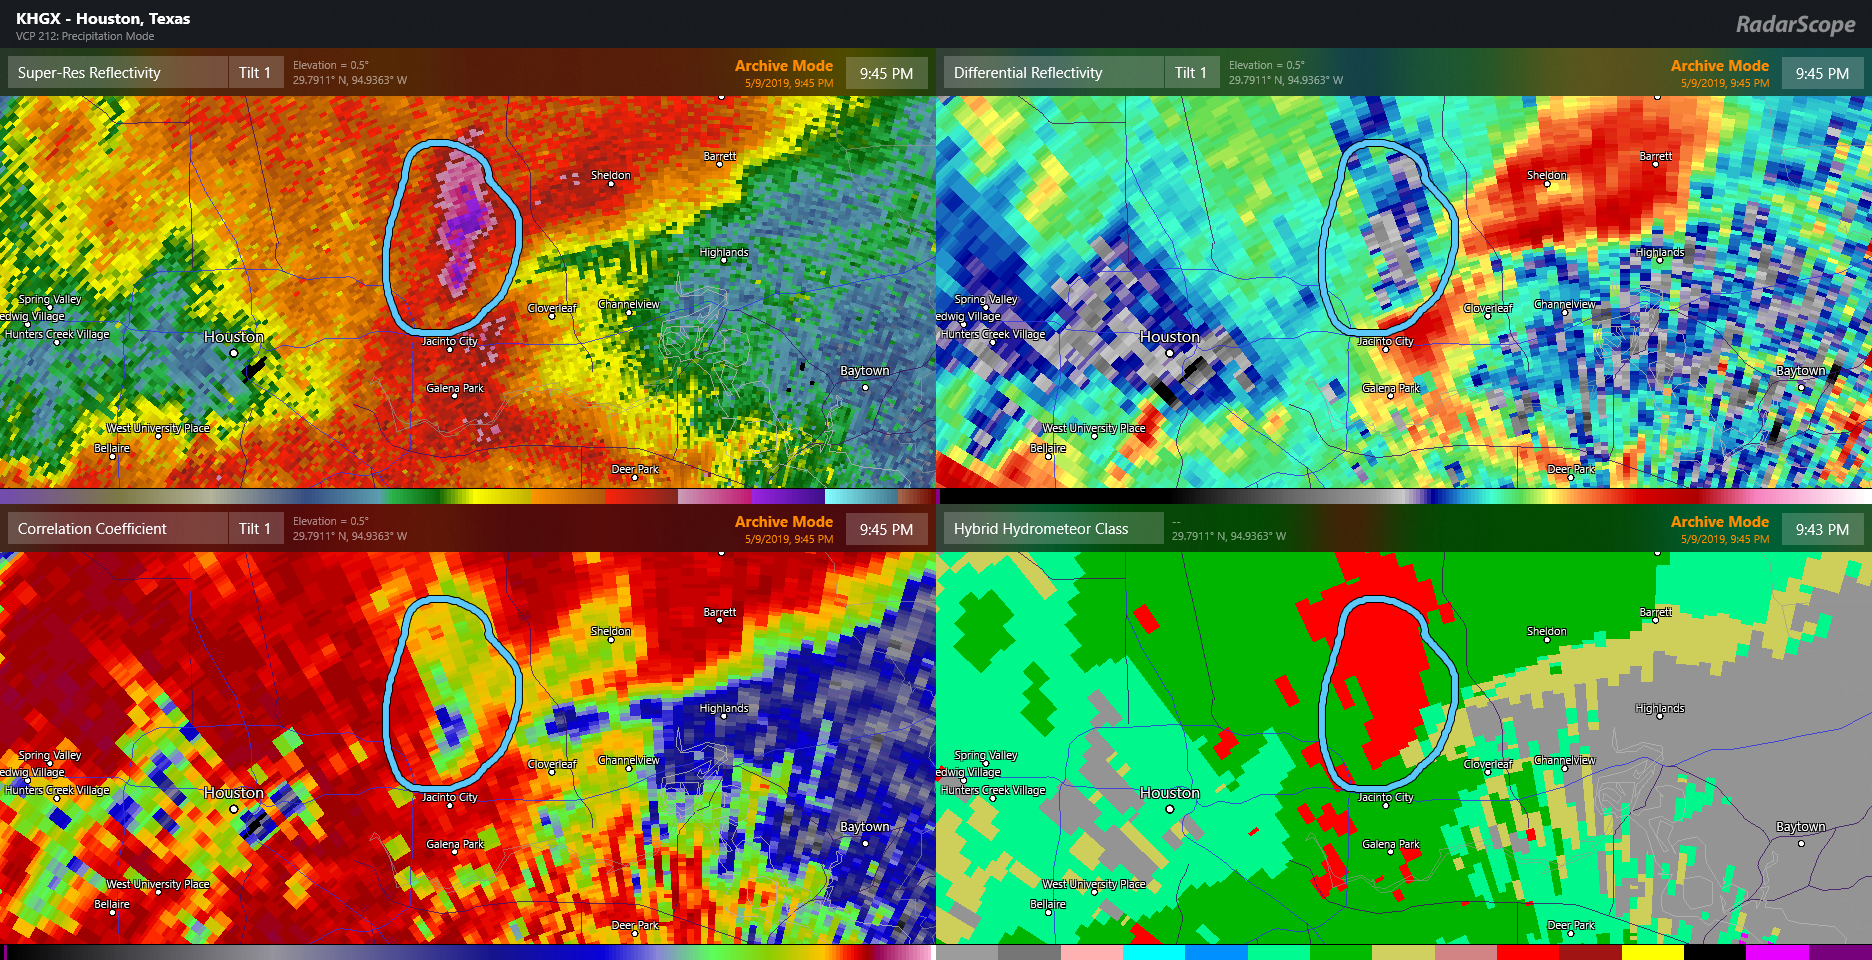
On the top left, again, we have reflectivity, what you typically look at when seeing radar. In this case, that’s a 75 dBZ reflectivity, which is among one of the highest I’ve ever seen here in Houston. That either means it’s raining incredibly hard, there’s hail falling, or both. In this case it’s both. On the bottom left, I again show correlation coefficient, which again is low. In this storm, it was down to about 0.75 to 0.8, or even lower than in the Cinco Ranch storm. On the top right, I am showing you a product called differential reflectivity (ZDR), which is assessing the shape of the objects falling from the sky. Typically, in hail, the ZDR is down around 0 to 2 dB or so. In this case, the ZDR was down around 0, coinciding with the highest reflectivity and a low correlation coefficient. There absolutely was big hail falling from this storm. And clearly, the damage in that part of the city backs this up. The bottom right image is a radar derived tool that predicts what type of precipitation the radar is detecting. In this case, the red color indicates mixed rain and hail.
This is by no means an expert-level course in using radar, but this should help you to understand a little bit about the basics we are looking at when assessing what threats different storms pose. Last Thursday featured many examples of large hail, something we do not often see here in Houston.
(I am not above abusing my server admin powers to post this image)
Neat stuff
Thanks for educating the masses!
We did have a golf ball sized hailstone that had 4 distinct layers. We are immediately south of Cinco. I did find a graphic of stone size versus critical updraft velocity but I was not able to post it here. Here are the details…
Quarter size hail needs updraft velocity in excess of 49 mph.
Golf ball size hail needs updraft velocity in excess of 64 mph
Hen Egg size hail needs updraft velocity in excess of 69 mph.
Baseball size hail needs updraft velocity in excess of 81 mph
Softball size hail needs updraft velocity in excess of 103 mph.
Broke a windowpane in our study. First time that ever happened!
I really don’t recall it hailing more here than when I was growing up in the Industrial Midwest, but the upper-limit SIZE of the hail here seems greater.I don’t remember seeing the stuff the size of baseballs until I got here.
At least our tornadoes are smaller here than the ones up north.
Fascinating! Love when you guys get into the science of weather. Really fun to learn and makes weather events even more interesting.
Agreed that these analyses are fascinating, but I prefer weather events that are more, not less, boring than what we recently experienced.
Interesting words for learnings thank you Matt this will help me comfort my dear Fulgencio the next time the hails come down. He was inconsolable when the hails came last time I really had do dig in to my bag of tricks to calm him down! I hope the hails stay away I wish blessings on all affected by them.
Excellent post and elaboration on the science of this phenomenon.
Now how do I get access to ZDR data?
Zdr appears to be in dual pol which is available in RadarScope pro tier 1.
Love these posts getting into the science of our weather! You guys are the greatest! Keep up the great work!
Hail looked like sweet gum tree balls dipped in white chocolate. Very bumpy.
Thanks for this informative and interesting post! So why are there so fewer hail days in the western U.S.?
Good question. They get fewer storms out there, so it just becomes a math problem at that point…less opportunities for hail.