In the wake of Tropical Storm Imelda, Eric and I wanted to reintroduce the Space City Weather Flood Scale, as well as place that memorable storm in its proper context. We’ll tackle Imelda in a moment, but first just a a few words about the slightly revised flood scale.
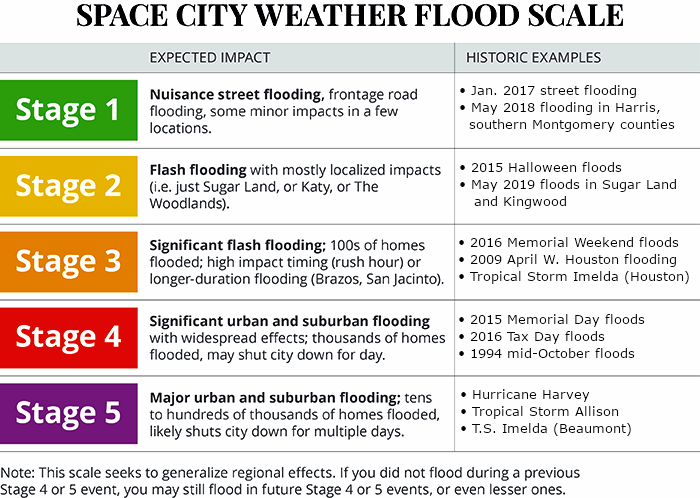
When we first introduced the flood scale, we didn’t really go too much depth on the various stages. We now realize that leaving any ambiguity in the interpretation of this was probably a mistake, so the goal here is to explain our scale in more depth and detail so readers have complete clarity on what it is meant to convey.
Origin & what it does
In the wake of Hurricane Harvey and all the flooding events in recent years, it occurred to me that we needed a way to put future rain forecasts in context with past events. Eric and I decided on a five-stage, or category scale. The scale is not meant to be perfect for everyone. Nor is it meant to replace forecast advice or direction from the National Weather Service or emergency managers. All it is meant to do is to set a realistic expectation ahead of a rainfall event that we feel could produce newsworthy flooding. We just want to attempt to help people navigate their anxieties regarding flooding that we know are widespread after recent years.
The scale is meant to characterize, in the general grand scheme of things, how the flood will be remembered for in Houston. Yes, your car may flood in a nuisance street flooding event, “only” a stage 1 on our scale. For you, personally, that may be a stage 5 life event. While that would certainly be unfortunate, for the greater Houston area, nuisance street flooding is rather common, and Stage 1 events happen at least a few times per year. What we want to do is make sure people understand that an upcoming rain event is more like that than a Memorial Day 2015 event, a Tax Day 2016 event, or an Imelda, and vice versa.
What it does not do
This scale is not going to tell you if you will experience flooding. Every flood event is unique. Just because you may have received 40 inches over 5 days and not flooded during Harvey, that does not mean you also won’t flood during a storm that only produces 6 inches of rain that falls in a single hour. Flooding in any given rainstorm depends on numerous factors, including quantity of rain, duration, intensity, neighborhood drainage, and conditions in place prior to the rain. Since no two storms are identical, you cannot always rely on past storms to tell you how future ones may impact you in your backyard.
The historic examples are not meant to apply perfectly to any one individual neighborhood. We may classify an event as stage 2 because it caused localized flooding in The Woodlands or Kingwood or Sugar Land. For some folks in those neighborhoods that flooded, that historic example may feel like a stage 3 or 4 event because of the problems it caused you and your neighbors. In other neighborhoods, you may not have noticed a drop of rain. What we want to do is put the event into context in the Greater Houston area. This scale is a perfect example of “your mileage may vary.” We recognize that, but we also know there is no perfect scale. This is the closest thing we could think of to a one-size fits all solution.
The scale is just attempting to characterize the “personality” of the flooding event we expect.
Let’s take you through each stage and discuss what each one means and what the past events did.
Stage 1
Our first stage applies to what we see in Houston a few times each year. These are the nuisance street flooding events that may occur over parts of the city. This is the type of event where you say, “Oh, yeah, there will probably be high water on the frontage roads of 59.” Or, “I-45 at North Main probably is flooded.” The spots that typically see water cover the road when it rains heavily will likely see flooding or ponding in a Stage 1 event. Stage 1 events would be more of a widespread event over the city of Houston than anything.
Historic Stage 1 examples:
January 18, 2017 flooding:
During this event, many Houston streets flooded right during the morning rush hour, as did some bayous. HISD had a two hour delayed start, and Highway 288 flooded.
May 20, 2018 Flooding in North Houston:
This event was mostly across northern Harris County into The Woodlands. Anywhere from 2 to 7 inches fell. Parts of southeast Harris County saw little to no rain. This primarily caused street flooding in that area.
Another Stage 1 example would be the flooding on July 4th, 2018 which postponed Houston’s non-fireworks festivities.
Stage 2
The second stage is meant to take things up a notch. Events falling into this category may cause significant, widespread street flooding across large swaths of the area, flooding numerous cars. Other examples of what we would consider stage 2 events are ones that flood dozens of homes in small, targeted areas or specific neighborhoods. These events are either moderate impact over a large area or high impact over a relatively small area.
Historic Stage 2 examples:
Halloween 2015:
In the week leading up to Halloween in 2015, significant rain fell on most of the area, partially as a result of the remnants of Pacific Hurricane Patricia. While minimal flooding occurred with Patricia, it set the table for flooding by the weekend of Halloween. From October 31-November 1, as much as 12 to 13 inches of rain fell across eastern Harris County, leading to bayou and river flooding.
In much of central Houston and points west, flooding was mostly minor to moderate (or non-existent). As you moved east of downtown Houston, flooding issues worsened. We likely would have forecast a Stage 1 event leading into the storm. This may have qualified as a Stage 3 flood for parts of eastern Harris County, but we feel this verified as Stage 2 for the broader region as a whole.
Kingwood & Sugar Land flooding of May 7, 2019:
On May 7, 2019 isolated to scattered storms popped up across the Houston area. In most cases, locations saw anywhere from 1 to 4 inches of rain. A few spots saw more, but in Sugar Land and Kingwood, rains fell fast, furious, and led to widespread flooding in those communities.
In Kingwood, the rains came in the afternoon, falling at the rate of as much as 3 inches in an hour. This overwhelmed drainage in the area, leading to around 150 homes being flooded. Later that day, heavy rain parked over Sugar Land, causing widespread street and car flooding. As much as 10 inches or even a bit more fell on May 7th there. This qualified as a Stage 2 flood because of significant but highly localized impacts.
Stage 3
Our third stage is probably the most difficult stage to define. These are storms that may be quite memorable for parts of the Houston area but not for the entire area. These are basically larger, more damaging versions of Stage 2 events. You could expect perhaps hundreds of homes flooding in multiple neighborhoods during Stage 3 events. We might also classify a longer-duration flood on the Brazos or San Jacinto River as a Stage 3, provided it impacts homes and neighborhoods significantly.
Historic Stage 3 examples
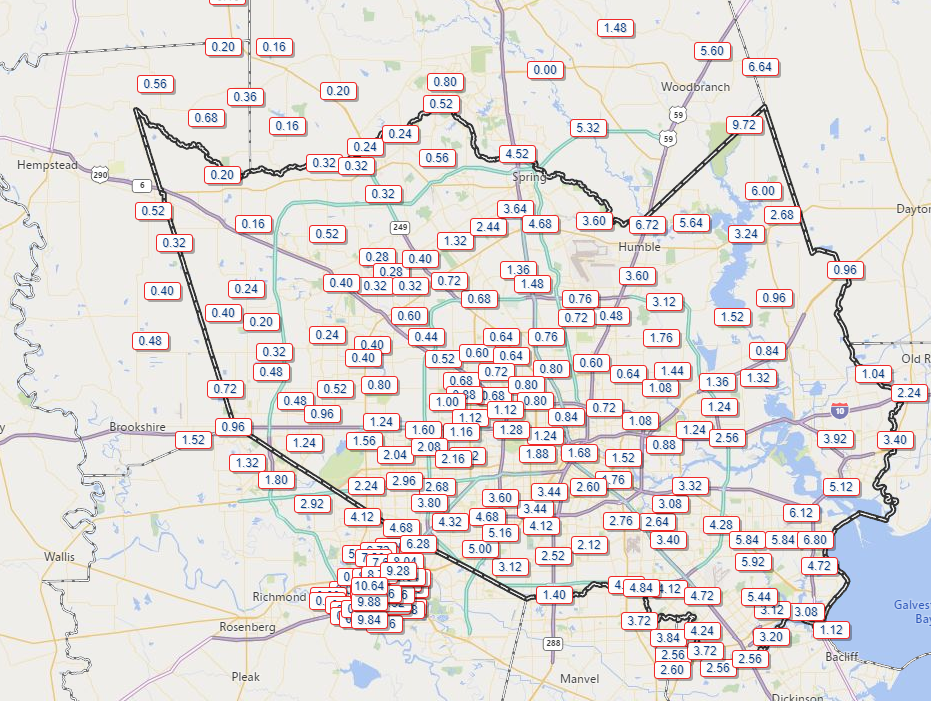
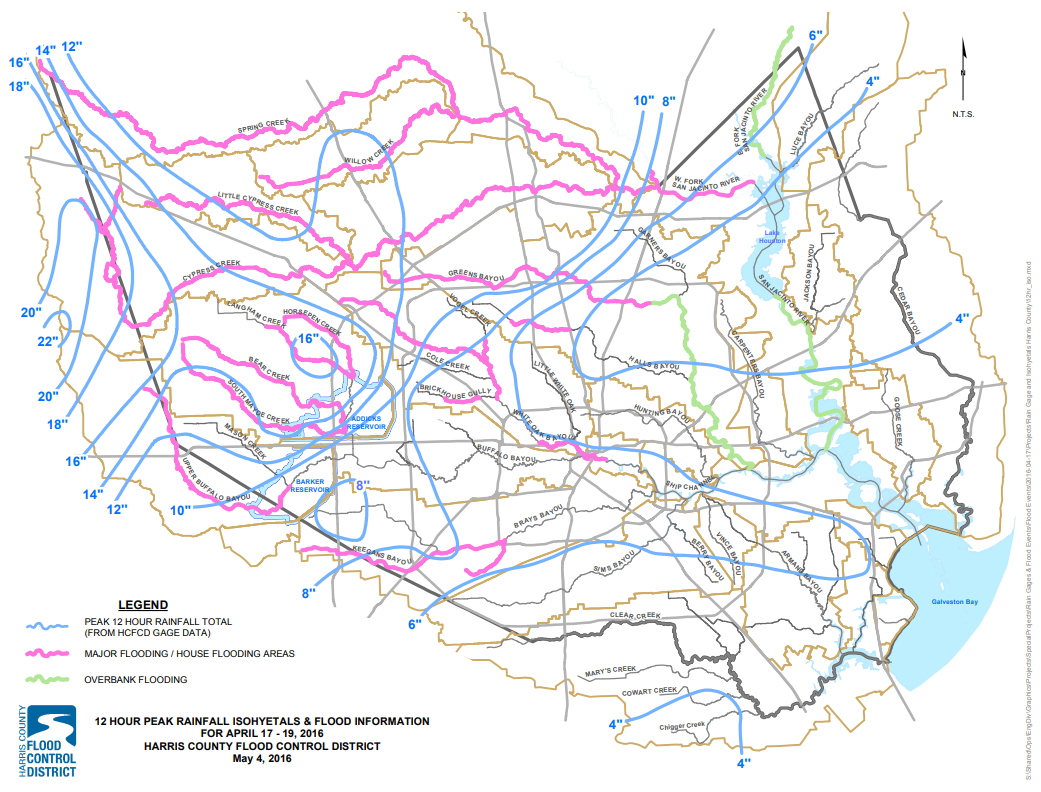
Memorial Weekend 2016 in Northern Harris County (May 26-27):
A very wet spring 2016 continued to roll through the month of May, capped off by a significant flooding event north of Houston on Memorial Day Weekend. The Thursday prior saw significant rainfall in the Brenham area, but on Friday we saw widespread heavy rain across the rest of the Houston area.
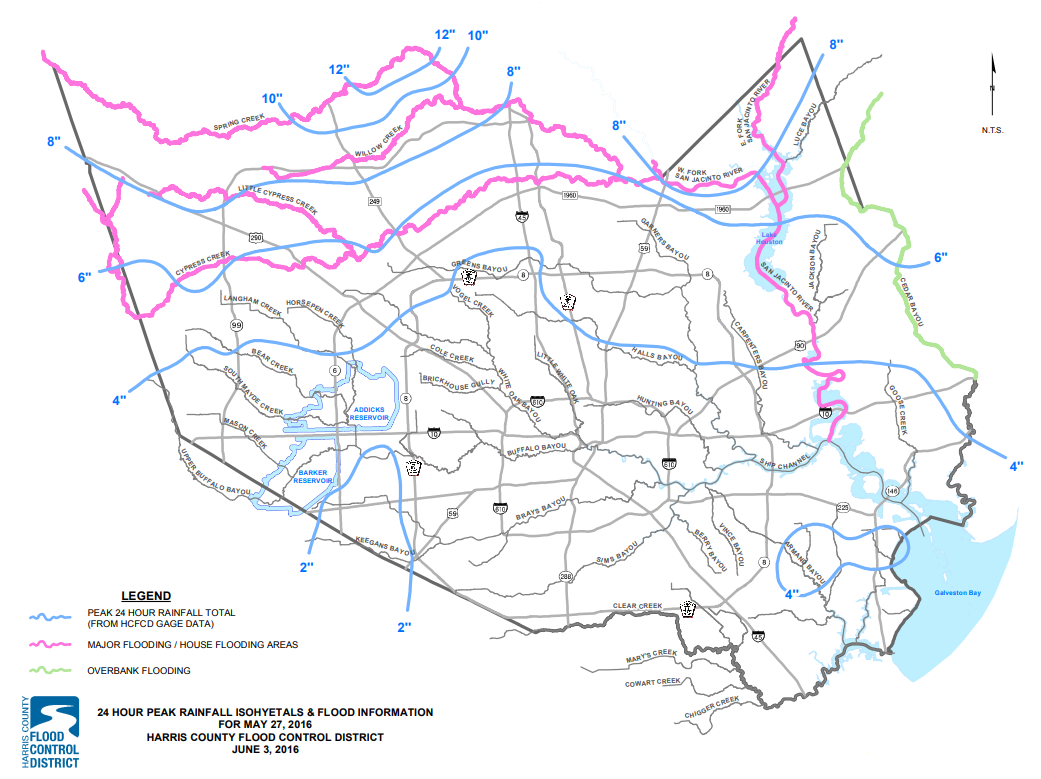
Rain totals exceeded as much as 13″ in far northern Harris County, all of which led to flooding along Spring Creek, Willow Creek, Little Cypress Creek, and Cypress Creek. In addition, both the Brazos and San Jacinto Rivers experienced significant flooding due to this event. Prior to Harvey, this event ended up being the flood of record on the Brazos River at Richmond, which crested at 54.74 feet.
Given the historic, long-duration flooding on the Brazos and the fact that about 100 homes were flooded across northern Harris County, this event ranks as a Stage 3 flooding event.
April 28, 2009 Flooding:
After an extremely stormy mid-April, a final round of rain moved through Harris County on April 28, 2009. Some parts of the county received in excess of 10 inches, some of which fell at 3 to 5 inch per hour rainfall rates.
Approximately 2,150 homes were flooded across Harris County, mostly in Jersey Village and Bear Creek, in addition to widespread freeway flooding. Given the widespread impacts and significant home flooding in parts of the county, we rated this storm as a Stage 3 event.
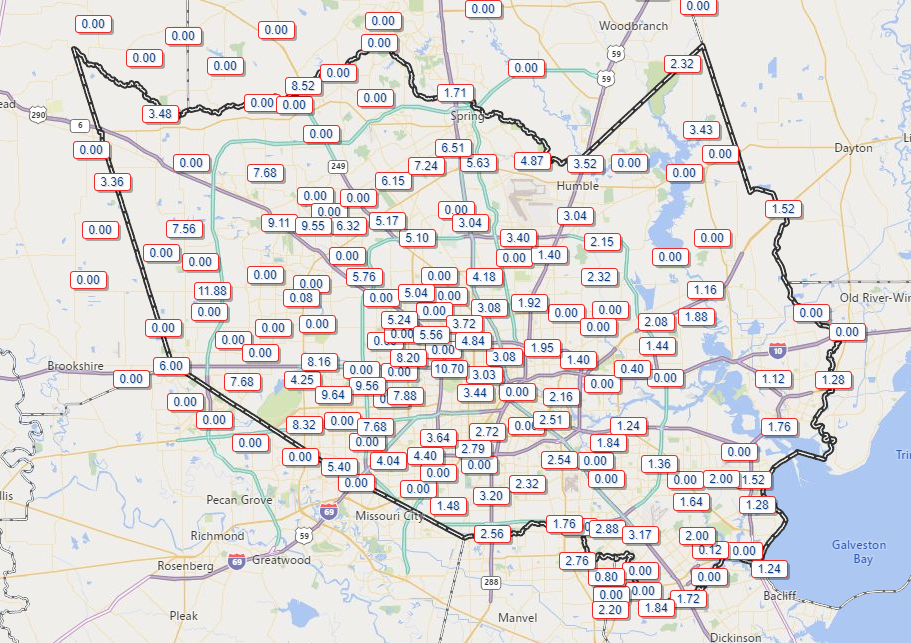
Tropical Storm Imelda (September 17-19, 2019):
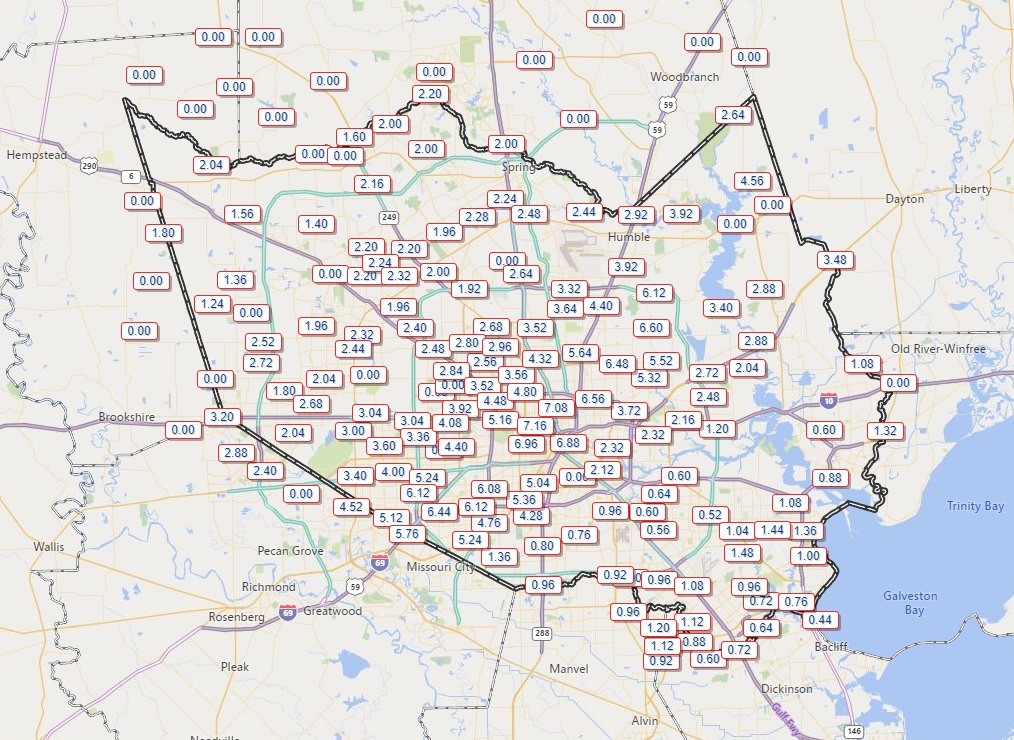
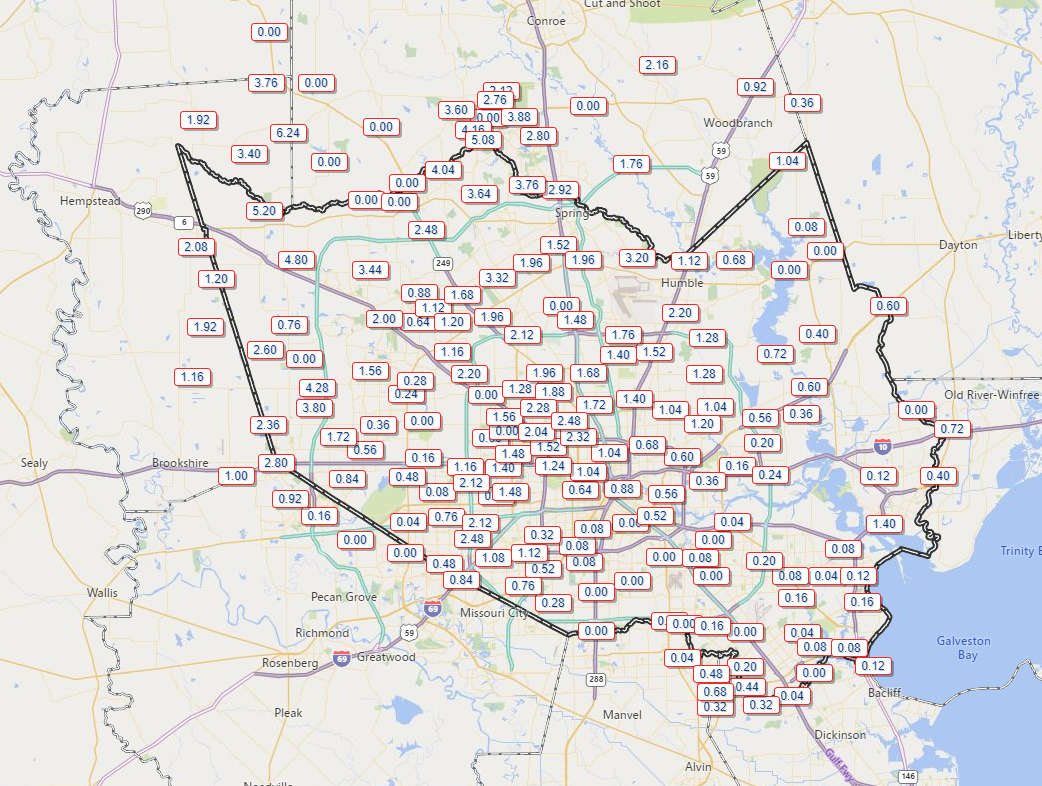
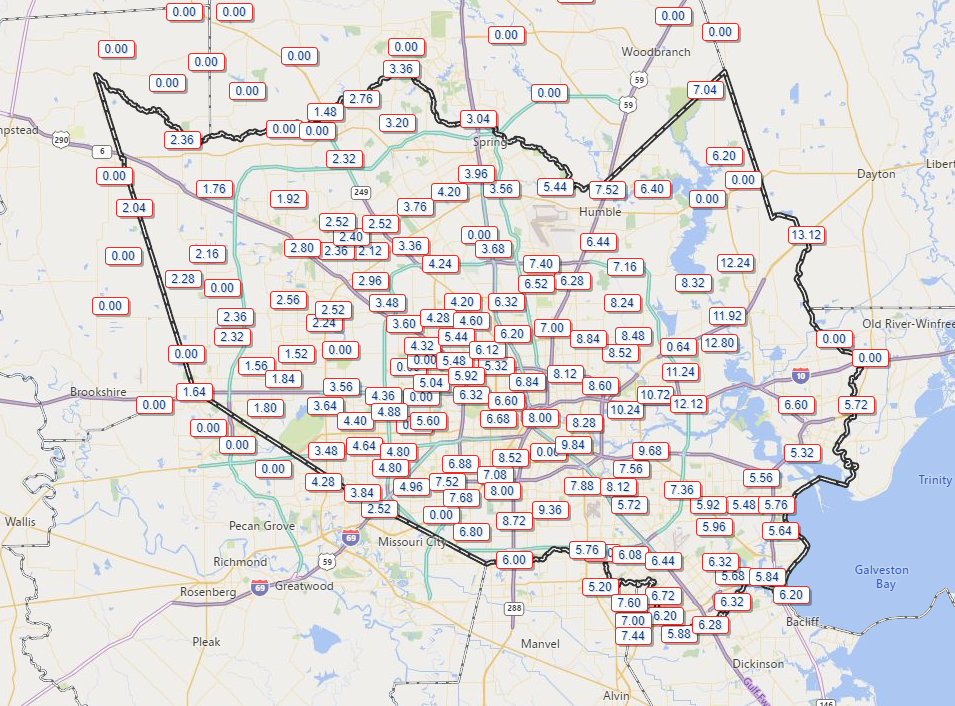
While this was extremely difficult to rank, we have settled on Imelda being a Stage 3 event for the Houston area. Damage is still being calculated, but early indications are that approximately 1,000 to 1,500 homes flooded, mostly in the eastern third of Harris County. For the Beaumont, Winnie, Liberty County areas, this event was clearly a Stage 4 or 5 storm. (Note this distinction on our revised flood scale above). While we have numerous readers from those areas, we want to keep the Space City Weather scale focused on the Houston area. For eastern Harris County, this was probably a Stage 4 storm. But for the city of Houston, however, this qualifies as a Stage 3 event. Some folks in western Harris County barely saw any rain at all, so this event may not have even registered out there. Thus, we have decided to compromise with labeling Imelda a Stage 3 storm for the Houston area.
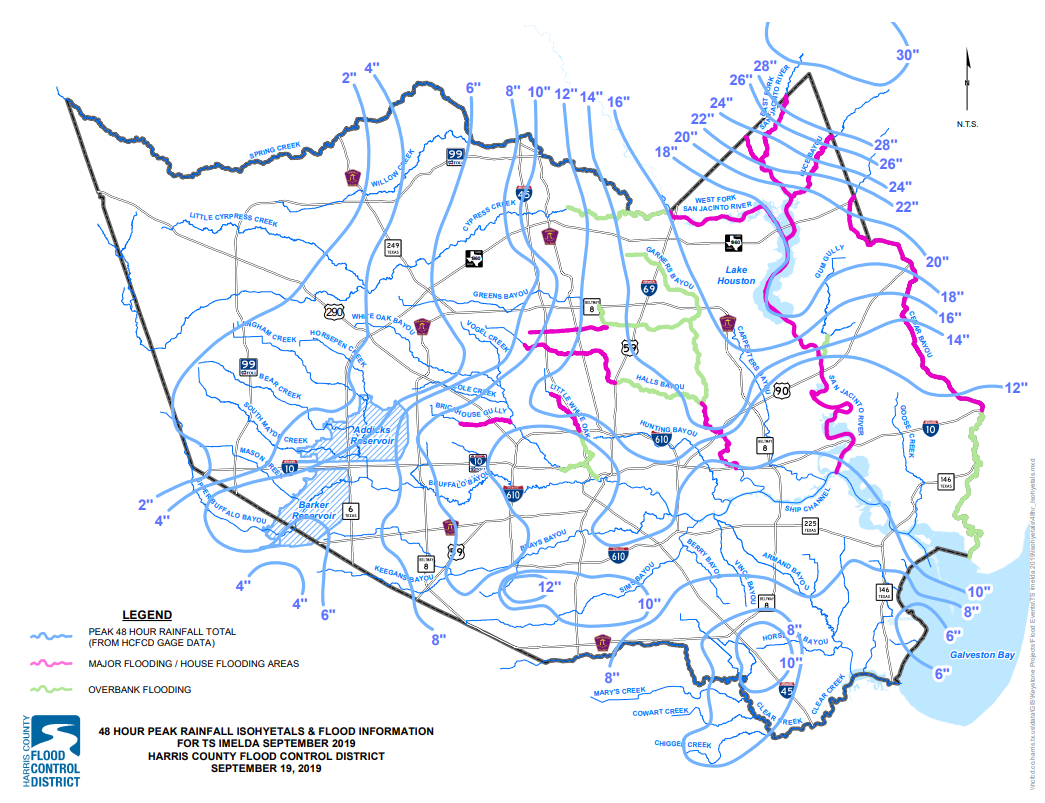
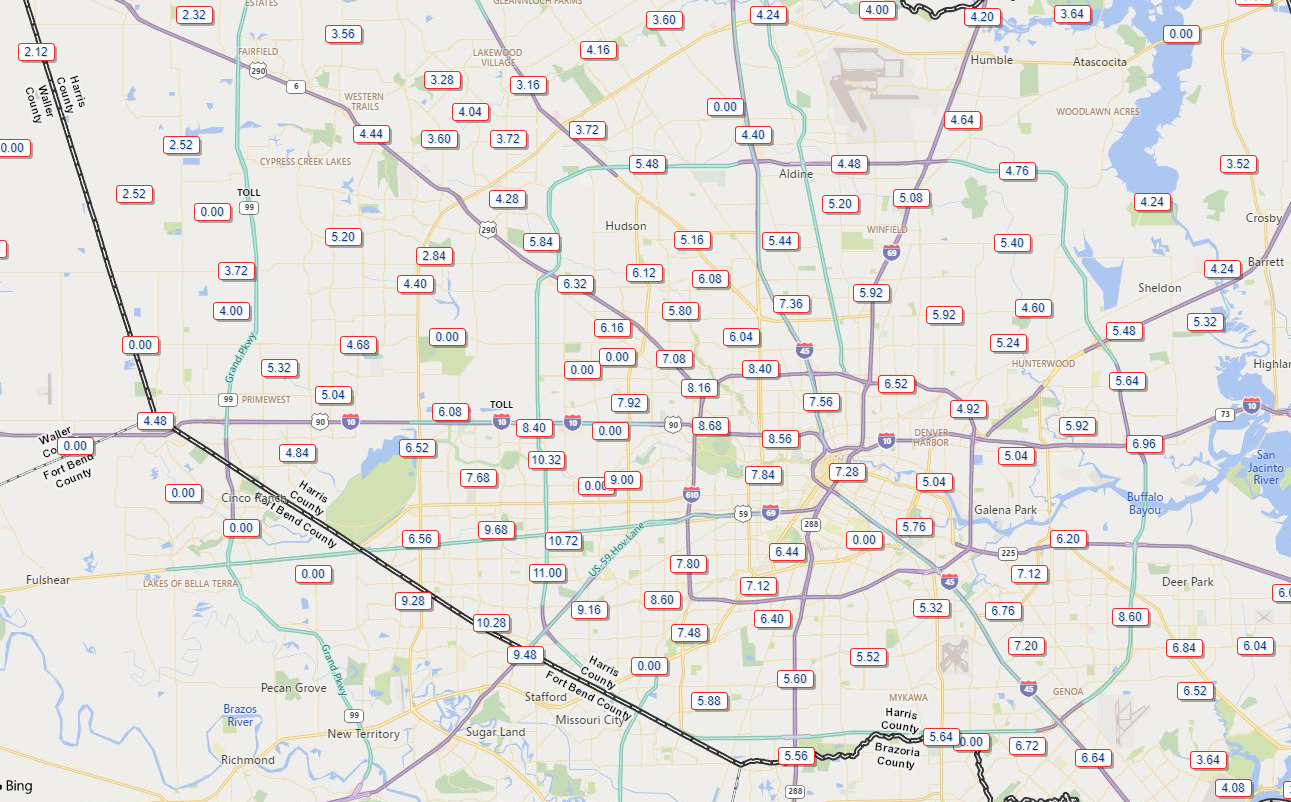
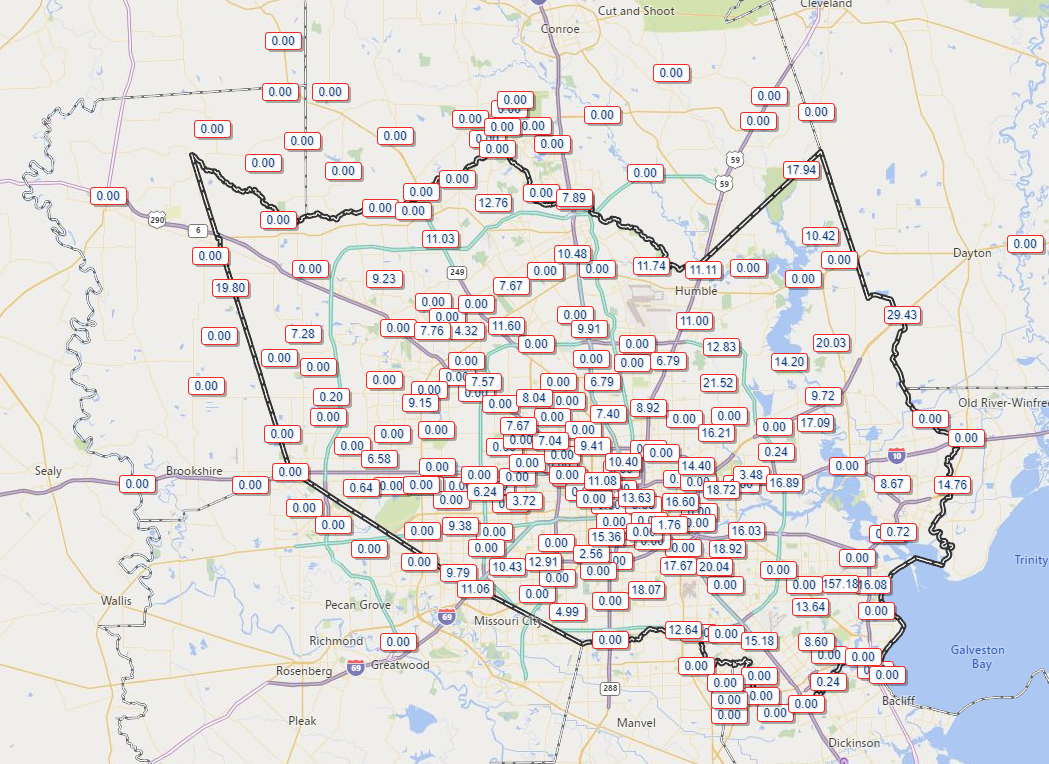
Imelda’s rainfall gradient was incredible across Harris County, with some places seeing less than 2 inches in the northwestern part of the county, while the northeast corner of the county hit about 30 inches over 48 hours. There were thousands of water rescues during this storm, particularly on Thursday the 19th, as rainfall rates locally in excess of 6 inches in one hour (6.4″ in one hour along Greens Bayou at Highway 59) moved south across the Houston area. These rainfall rates rivaled peak hourly rainfall rates of Harvey and Allison. Obviously, those two storms lingered longer in Houston, leading to catastrophic flooding.
Imelda will rank as a “100-year” storm, when using exceedance probability data from recently revised NOAA maps for the time periods of 3, 24, and 48 hour rainfall totals.
Stage 4
Getting into Stage 4 level storms is when you start getting into the extremely infamous events. These are storms that flood hundreds to thousands of homes, causing significant damage, leading to long-term impacts. Stage 4 events can usually be identified by name or date and most people will know of them.
Historic Stage 4 examples:
Memorial Day 2015, May 25-26:
The Memorial Day 2015 flood featured the first instance of the National Weather Service forecast office issuing a “flash flood emergency,” the highest level of flood warning in the Houston area. It also began a series of floods in the Houston area, culminating with Hurricane Harvey in 2017.
11 inches of rain fell during a short period during the evening of Memorial Day (May 25), ending the next morning. Flooding was particularly catastrophic in the Meyerland neighborhood of Houston. When all was said and done, somewhere on the order of 2,500 to 3,000 homes had been flooded. This qualifies as a Stage 4 event because it produced an extreme amount of rainfall in a short period of time over Harris County.
Tax Day 2016, April 17-18:
The Tax Day storm was a ferocious flooding event for the Greater Houston area which flooded over 7,000 homes and caused over $2.5 billion in damage, mostly in Houston.
Over 20 inches of rain fell in far western Harris County during this storm, most of it in a 10 to 12 hour period. This established record flows at the time into Addicks and Barker Reservoirs west of Houston.
October 1994 flooding
Prior to Harvey and Tax Day and Allison, there was October 1994. This event was a long-duration one, featuring moisture from Pacific Hurricane Rosa, as well as moisture off the Gulf feeding a strong Plains/Rockies storm. The end result? Over 15,000 flooded homes and nearly $2 billion in damage.
Over 20 inches of rain fell between October 15 and 19 across parts of eastern Harris County, as well as north of the Houston area. This led to catastrophic flooding along the San Jacinto River, Trinity River, as well as Cedar Bayou.
The most horrifying aspect of the 1994 flood was a ruptured gasoline pipeline in the San Jacinto River that ignited, leading to a massive fire and catastrophic damage along the riverfront.
Stage 5
Our highest level on the flood scale is reserved for only 2 entrants in modern history: Allison and Harvey. Prior to Harvey, 2001’s Tropical Storm Allison had been the benchmark storm in the Houston area, so much so that the Harris County Flood Control District’s post-storm report was entitled “Off the Charts.”
Allison dumped as much as 28 inches of rain in 12 hours and just shy of 40 inches of rain over 4 days. The resulting flooding was catastrophic, with over 70,000 homes damaged or destroyed. Damage exceeded $12 billion in total.
As for Harvey, what can be said that has not been said already? Harvey is the benchmark for storm events in Southeast Texas, and we hope that there never comes a day that we see anything remotely rivaling this in Houston. Harvey’s damage totaled at least $130 billion.
Over 150,000 homes flooded in Harris County alone. It is estimated that 300,000 vehicles also flooded during Harvey in Harris County.
Stage 5 events would be the rarest of the rare. We hope to never utilize this in our pre-storm messaging.
Note: All pages linked to in this post are live and working as of September 29, 2019. Please let us know if you encounter a broken link.
For the life of me I can’t remember this 2016 Memorial weekend flood. I don’t think I’ll ever forget Imelda. Yet they are both Stage 3 Events. Trickiest category on there, at least to me.
Thank you for the excellent work.
I have lived in Houston since 1969 and have weathered many flooding events. Whether you’re new to Houston, or lived here for years, the scale and respective Stage levels is (IMO) is an excellent reference chart. As stated, not all areas fall into the same stage category per event. Personally, we did not flood in Harvey, but the impact it caused is relative to what could happen in any given area. Thank you Matt and Eric for ALL you do. Following SCW helps minimize the PTSD my 81 yo mother has following the Tax Day flood, in which she lost her home, car and everything else.
Wow, this is massive! Thank you!
“The most horrifying aspect of the 1994 flood was a ruptured gasoline pipeline in the San Jacinto River that ignited, leading to a massive fire and catastrophic damage along the riverfront.”
I remember some local comedian working that into his act- You think you have floods?!?!?!?! OURS are on FIRE!!!!
A good point about just because you didn’t flood in some previous rain apocalypse is no guarantee you’re in the clear next time. I was in a 25-29.99″ zone with Allison and a 35-39.99″ zone with Harvey, but the event I thought was going to flood my house was an unusually intense local thunderstorm back in the Spring of 2010 that was dumping rain at a rate of 4″ per hour. After that I broke out the shovel and put a French drain in the back yard. That probably helped for Harvey.
Flypusher, I seem to recall that bit was by Ron Shock, or maybe Bill Hicks.
Thank you!
I appreciate the new perspective and detail and reasoning. This allows me to create my own flood scale, which is just switching the Memorial floods – 2015 was a Stage 3 while 2016 was a Stage 4 and everything else fits perfectly. Of course, my flood scale is based solely on what the San Jacinto River has done…(and SJRA).
Great job updating!
In this current era when some people panic at the drop of a pin, your no-nonsense “flood rating system” is a great help!
I personally have been through an earthquake (1994, CA, and unpredictable), multiple tornado warnings (Tulsa 1984-93, saw one from 10 miles away in April 1993), and a 1986 rain event in Tulsa that dumped a year’s worth of rain in less than a week. Only the excellent operation of the Corps of Engineers dam NW of Tulsa prevented a flood of the entire downtown area.
I moved to The Woodlands in 1998. Based on the 1994 flood, I’ve bought flood insurance every year since. I urge everyone else to do so.
No one knows if another Allison, Harvey, Imelda and the other floods in the area will occur. Often, as good as the science is, it’s not perfect.
Thank you Eric and Matt for this excellent analysis.
I agree with the updates, and I appreciate the periodic reviews of what your flood scale is meant to do. Not only is repetition the mother of learning, but also repetition is the mother of learning.
Wise words from the Department of Redundancy Department! 🙂
So many homes and businesses badly flooded by Harvey have rebuilt exactly where they were. Up here near Champions, all the businesses and apartments/homes and government buildings flooded on Cypresswood Dr. have been rebuilt. This is the dumbest thing I have seen. That whole area along Cypresswood should be turned into a park. Upstream, the land in the Cypress Creek watershed that used to hold floodwater is being developed into subdivisions, so the future will be even worse.
Thank you for your excellent information as always. I had a horrid time during Allison and Ike and am very thankful Harvey and Imelda didn’t affect me personally as much as the previous two. I have also been through the Northridge Earthquake in Los Angeles in 1994 and was here alone during Ike. I haven’t been as scared as I was during Ike, and hope never to be again. I really appreciate your no-nonsense and no-hype reporting.
I too went thru the Northridge quake, having lived in Simi Valley 1993-98. That is something I don’t wish to experience again, despite no damage to my house. No advance warning, and then all the aftershocks . . . .
“ When we first introduced the flood scale, we didn’t really go too much depth on the various stages.” LOL
Wow. Thank you so much for the information! So educational! You guys are the best!
This is great information. Thank you putting it all together in one place. And…GO ASTROS!!!
Your scale is really useful context for someone who hasn’t grown up accustomed to the weather along the gulf coast. Thanks for taking the time to revisit the scale and put Imelda in context for us.
Every newcomer to Houston I meet, I warn there’s two things you cannot run away from: the State Trooper and Flooding. Harvey was an emotional one, since I had to personally save a college student from driving into Brays Bayou, later housing her overnight. The sights of elderly people dangling from helicopters… The authorities were utterly unprepared for the flood. Imelda left an expensive mark – I was out of town and my car flooded.
Thanks so much for all the work you did and still do.
We need to learn the Whys of flooding.
We need to name the city planners and the bad engineers that plan underpasses and under level highways that become death traps.
Flooding is inevitable in Houston… Some areas should be returned to bayou land… Bellaire and parts of Meyerland for example. The elevated houses are very dangerous and will fail causing major accidents.